We’ve analyzed the prop firm industry from its early beginnings until now. The following statistics clearly show how this type of business grew at the fastest possible pace within a short period.
The mind-blowing facts clearly show what type of prop firms are the most popular ones, and what role income and population have. The biggest surprise of the brand new data as of 12/2025 is the significant growth of futures prop firm demand.
Keep on reading – it’s worth it!
► If you use our data in your content, please make sure to reference to this statistics as the original source with an attribution link to https://propfirmapp.com/statistics Thank you.
The Search Demand for the Term “Prop Firm” Increased by 5,525% between January 2020 and December 2025.
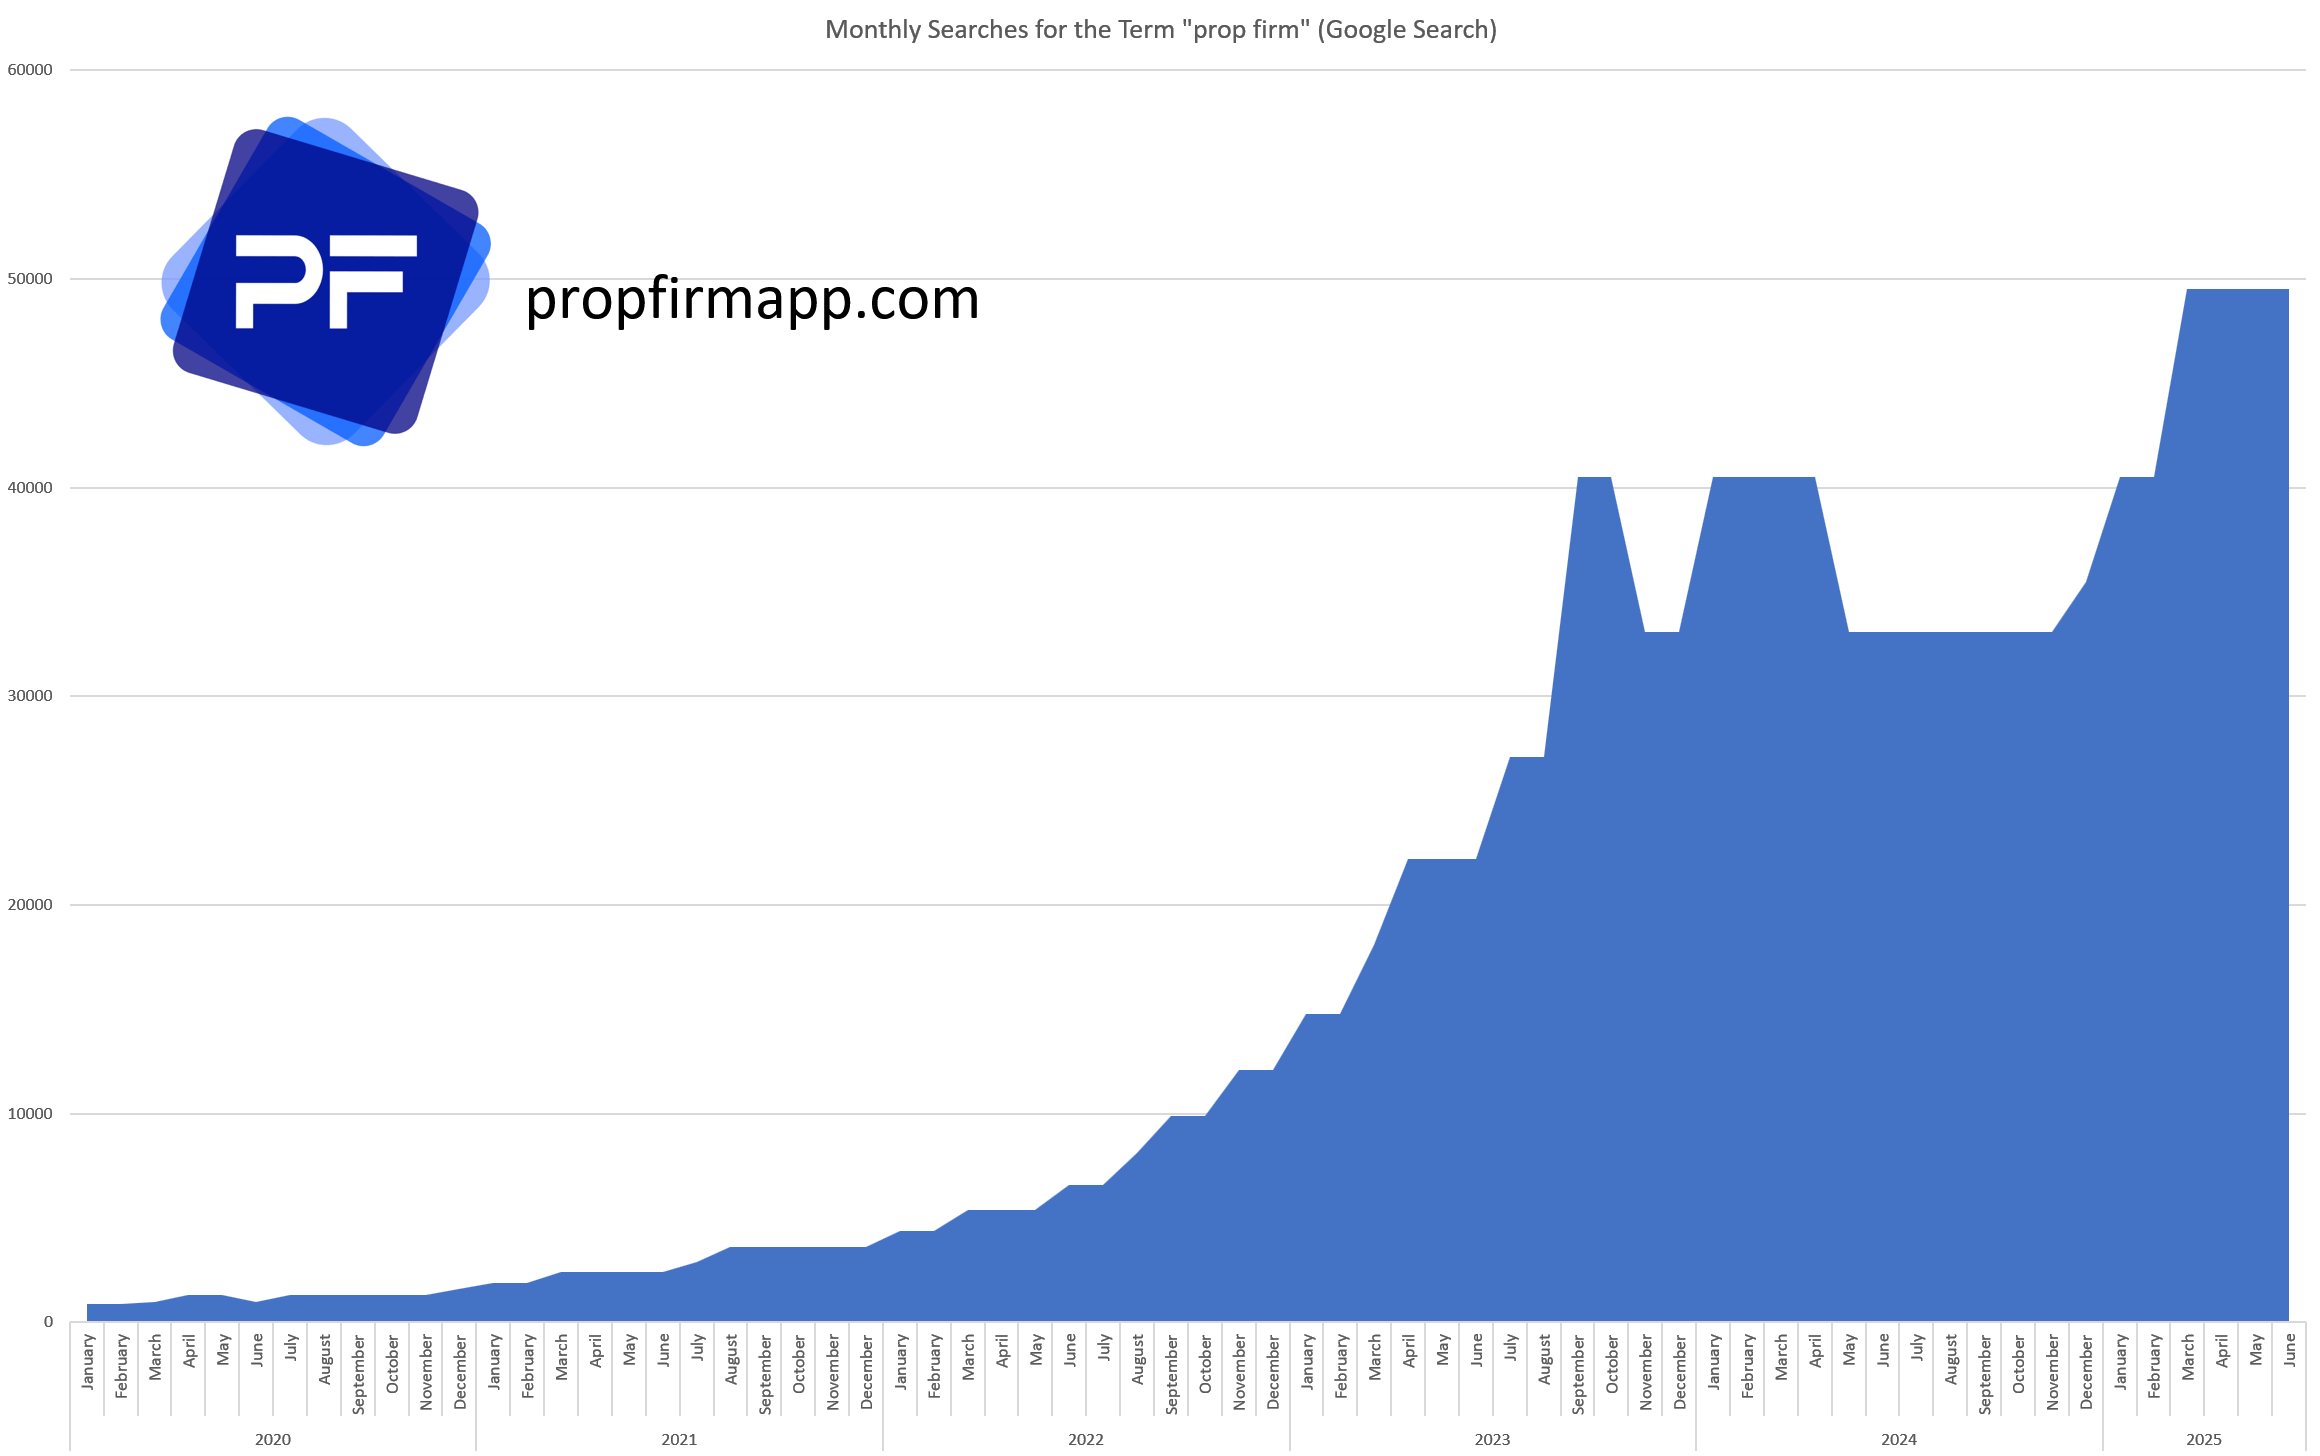
The global monthly search volume for the term “prop firm” was 880 in January 2020. Until October 2022, the search volume increased continuously but remained stable, with linear growth below 10,000 monthly searches.
In November 2022, there were more than 10,000 searches for the first time. In Q2/2025, there was an all-time high reached with 49,500 monthly searches, which currently stabilizes. The popularity rate continuously grew with impressive annual growth rates:
Annual Growth Rates:
- 2021 vs. 2020: +137%
- 2022 vs. 2021: +163%
- 2023 vs. 2022: +250%
- 2024 vs. 2023: +36%
- 2025 vs. 2024: +30%
Type Of Prop Firms Searched – Futures Now Clearly Lead vs. Forex
| Search Term | Global Searches |
|---|---|
| Prop Firm Forex | 5,400 |
| Forex Prop Firm | 5,400 |
| Forex Trading Prop Firms | 480 |
| Best Forex Prop Firms | 1,000 |
| Prop Firm Futures | 1,300 |
| Futures Prop Firms | 12,100 |
| Futures Trading Prop Firms | 1,300 |
| Best Futures Prop Firms | 4,400 |
When it comes to asset-specific searches related to a prop firm, forex-trading related queries had a total of 12,280 searches in December 2025 among the top 4 queries. Futures-trading related prop firm queries now skyrocket 19,100 total searches globally in December 2025.
This is one of the most insightful findings in our updated statistics as of 12/2025. Until Q2/2025, futures and forex-related queries were balanced, but now futures clearly lead across the industry. We see confirmation in this trend with former forex prop firms now adding futures trading to their offering.
Distribution of Prop Firm Searches per Country – 7 of the 195 Countries In the World are responsible for 59% of Search Demand
When looking at the distribution curve of searches for the term Prop Firm across countries worldwide, the United States leads the list (9,900 monthly searches), followed by India (8,100 monthly searches) and Indonesia (3,600 monthly searches).
7 countries cummulate to about 59% of the global search volume (29,200 out of 49,500 global searches as of December 2025), while the remaining 41% is distributed across the remaining 181 countries.
The market with the most tremendous growth is Indonesia, where the monthly searches is now about 5 times higher than 12 months before. Another interesting fact is that countries where various prop firms are prohibited, see good growth rates too (e.g., Nigeria and South Africa).
| Country | December 2025 |
|---|---|
| United States | 9,900 |
| India | 8,100 |
| Indonesia | 3,600 |
| United Kingdom | 1,900 |
| Nigeria | 1,900 |
| Italy | 1,900 |
| South Africa | 1,900 |
| Malaysia | 1,600 |
| Canada | 1,600 |
| Germany | 720 |
| Australia | 720 |
| Pakistan | 720 |
| United Arab Emirates | 480 |
| Singapore | 480 |
| Philippines | 390 |
| Kenya | 390 |
| Brazil | 260 |
| Bangladesh | 260 |
| Japan | 210 |
| Vietnam | 140 |
| Mexico | 140 |
| Ireland | 110 |
| Cyprus | 90 |
Ratio Prop Firm Searches To Population By Country Top 10 – Malaysia Leads
| Country | Prop Firm Searches | Population (mn) | Ratio Searches per mn |
|---|---|---|---|
| United States | 9900 | 348 | 28 |
| India | 8100 | 1470 | 6 |
| Indonesia | 3600 | 287 | 13 |
| United Kingdom | 1900 | 70 | 27 |
| Nigeria | 1900 | 240 | 8 |
| Italy | 1900 | 59 | 32 |
| South Africa | 1900 | 65 | 29 |
| Malaysia | 1600 | 36 | 44 |
| Canada | 1600 | 40 | 40 |
| Germany | 720 | 84 | 9 |
Malaysia leads the list when looking at the country-specific searches relative to the population (44 per 1 million people searched for the term prop firm in December 2025). Canada and Italy follow at numbers 2 and 3.
Ratio Prop Firm Searches To Average Income Top 10 – Highest Searches per Dollar Income In India
| Country | Prop Firm Searches | Annual Income (US$) | Ratio Searches / Income |
|---|---|---|---|
| United States | 9,900 | 83,490 | 0,12 |
| India | 8,100 | 2,650 | 3,06 |
| Indonesia | 3,600 | 4,910 | 0,73 |
| United Kingdom | 1,900 | 49,470 | 0,04 |
| Nigeria | 1,900 | 1,700 | 1,12 |
| Italy | 1,900 | 38,590 | 0,05 |
| South Africa | 1,900 | 6,110 | 0,31 |
| Malaysia | 1,600 | 11,650 | 0,14 |
| Canada | 1,600 | 53,400 | 0,03 |
| Germany | 720 | 55,090 | 0,01 |
The ratio between the number of country-specific searches and the average annual income reveals that countries with the lowest average annual income are responsible for the most frequent searches per dollar of income.
India has the 2nd-lowest average annual income, but has the 2nd-highest prop-firm search volume. That’s why it has the by far highest ratio of searches per dollar income.
Number of Prop Firms and Asset Search Volume – Most Firms In Forex, CFDs and Crypto, While the Strongest Assets are Futures, Stocks and Crypto
| Asset | Search Volume | Number of Prop Firms |
|---|---|---|
| Forex | 673,000 | 40+ |
| Futures | 1,200,000 | 20+ |
| Stocks | 1,500,000 | <5 |
| CFDs | 165,000 | 40+ |
| Crypto | 1,200,000 | 40+ |
Stocks, Crypto and Futures are the most frequently searched asset terms with global searches of over 1 million each. Forex and CFDs follow on places 4 and 5. Surprisingly, the number of prop firms does not relate to the popularity of assets.
- Forex and Crypto kind of correlate, with over 40 prop firms offering to trade those assets
- While stocks are the most popular asset globally, less than 5 prop firms offer this type of asset in their trading with a broad range of stocks.
The reason for this is multifold, but two aspects clearly stand out.
- The riskiest investment vehicles are those with the highest number of prop firms offering to trade the assets.
- Most prop companies offering assets like forex, stocks and crypto offer their assets to be traded via contracts for difference (CFDs), which are prohibited from trading for residents of the United States.
- If trading of stocks is allowed, typically only high-market-cap companies are available for trading, and once again, only via CFDs.
- Contracts for difference mainly dominate the European region, whith the lowest search volume, but it attracts most customers, even if the markups are high, spreads are bad and trade executions often lag.
Most Prop Firms Have Their Headquarters In the United States – Top 10 – USA Leads
| Country | Prop Firms Headquarter Count |
|---|---|
| United States | 11 |
| United Arab Emirates | 10 |
| United Kingdom | 7 |
| Canada | 2 |
| Israel | 2 |
| Czech Republi | 1 |
| Hong Kong | 1 |
| Switzerland | 1 |
| British Virgin Islands | 1 |
| Hungary | 1 |
| Netherlands | 1 |
| Spain | 1 |
| Liechtenstein | 1 |
Out of 40 analyzed prop firms:
- 11 have their headquarters in the United States.
- The second-most popular places for a prop firm headquarters are the United Arab Emirates (10) and the United Kingdom (7).
- Most US-prop firms are companies offering futures trading, while all companies in the United Arab Emirates offer forex trading.
- The remaining 12 prop firms are spread across the world with headquarters in Canada, Israel, Hong Kong, Switzerland, British Virgin Islands, Hungary, Netherlands, Spain and Liechtenstein.
Trading Growth +1,264% vs. Investing Growth +240% between 12/2015 and 12/2025

Prop trading is a subcategory of trading. Most prop traders are day traders, and some are swing traders, but they are typically not long-term investors.
The growth in the popularity of prop firms and prop trading made us wonder if there is a correlation between trading and investing in terms of growth.
Overall, trading is typically not mentioned very positively, while investing articles are all over the place. But what do the numbers say?
We’ve compared the search term frequency for both investing and trading and also took a look at prop trading and day trading terms. The results are pretty surprising due to the enormous trend strength of trading.
But let the numbers speak for themselves.
If you compare the end point vs. the starting point, you notice that the number of monthly searches for “investing” is still higher than for “trading” in Google search. On the other side, the growth rate in “trading” is much higher than in “investing”. Investing grew from 1 million monthly searches in December 2015 to now 3.4 million monthly searches in December 2025 (+240%). Trading at the same time grew from 0.11 million monthly searches in December 2015 to now 1.5 million monthly searches in December 2025 (+1,264%).
Things are even more interesting if you split down both categories on the timeline and separate into two time frames.
2015-2021
In December 2015, the ratio was clear. 1 million global searches for “investing” per month vs. 110 thousand searches for “trading.” The growth rates for both were exceptional until December 2021, when “investing” searches hit an all-time record at 6.1 million global searches per month, and 0.8 million searches for “trading”. Yet, things have changed significantly since December 2021.
2021-2025
The demand for the term “investing” fell 44.26%, from 6.1 million in December 2021 to 3.4 million searches monthly in December 2025. At the same time, “trading” further grew in popularity and nearly doubled from 0.8 million monthly searches in December 2021 to 1.5 million monthly global searches in December 2025. The trend of higher demand for “trading” terms has never reversed since 2015.
From an absolute value objective, there are still more searches for investing, but the percentage gap in between is now much smaller.
We can only speculate about possible reasons. The most likely ones are that investors are looking for higher returns with active trading. Maybe they put the majority of liquidity now in high-yield savings accounts and speculate with a minimal part of their money in potentially higher-rewarded trading styles.
Another potential reason could be that the overall budget a family has to invest shrunk due to high inflation numbers, forcing the investor to try to make more money with less capital in higher-risk financial market activities.