Most traders waste hours manually scanning charts and testing strategies. TrendSpider attempts to solve that problem by automating technical analysis with AI: trendline detection, chart pattern recognition, multi-timeframe analysis, and strategy backtesting, all without touching a line of code.
For prop traders specifically, the full integration of U.S. futures markets is the real selling point. ES, NQ, CL, GC and the micro contracts are all supported, meaning you can scan, chart, and backtest the exact instruments you’ll be trading in an evaluation. Exact instrument availability and real-time data access can vary by plan and data package, so it’s worth checking the current plan details before subscribing. That said, traders preparing for prop firm evaluations consistently report using TrendSpider to build and stress-test strategies before real challenge capital is on the line.
Prop Firm App is reader-supported. If you click on a link, our partners may compensate us.
TrendSpider Pros and Cons
Pros
- 40+ years of market data available
- Sidekick LLM and AI Coding Assistant handle chart analysis and custom JavaScript indicator building inside the platform
- Plain English market scanning, including scheduled scanners and 700+ pre-built Smart Watch Lists, saves hours of manual chart hunting
- 400+ pre-built indicators, plus automated Fibonacci detection and support/resistance plotting
- Covers futures, stocks, crypto and forex data in one platform
- The full-access trial gives you 14 days to properly evaluate before committing
Cons
- Noticeably more expensive than TradingView for comparable charting functionality
- Steep learning curve, the depth of features can feel overwhelming early on
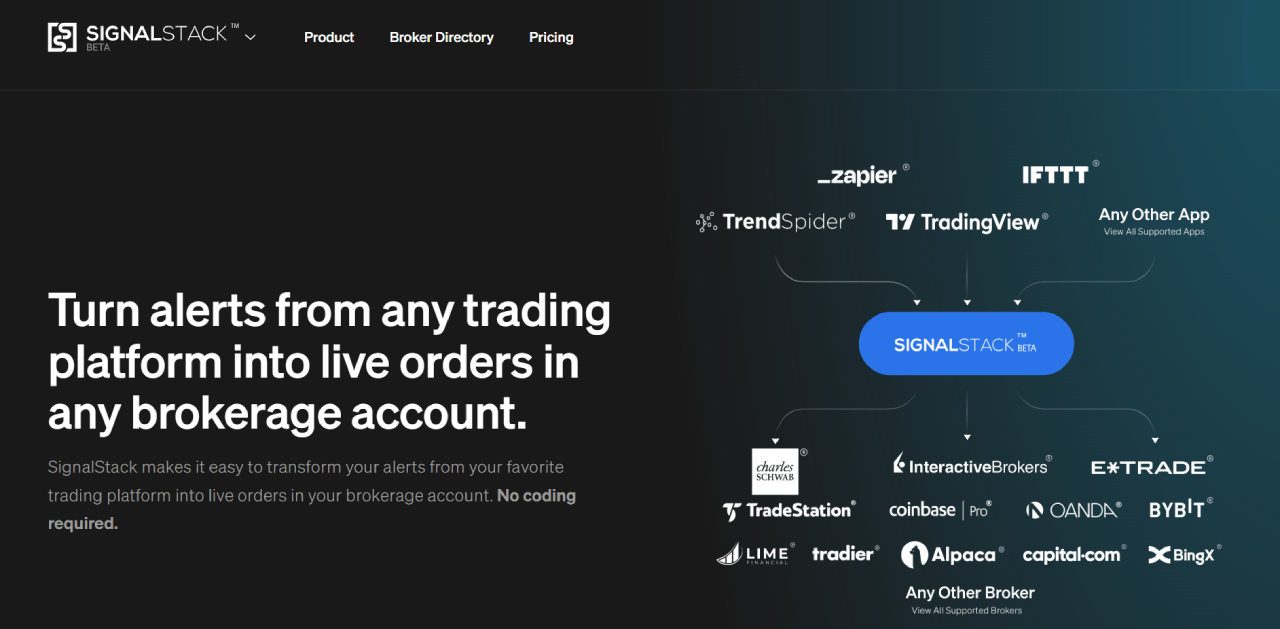
- Live order routing requires an extra step: TrendSpider supports analysis, alerts, bots, and automation workflows, but actual order execution is handled through the Trading Widget and SignalStack integration with supported brokers. It works, but it’s not a one-click setup
- Some of the more advanced features, like multi-timeframe analysis and strategy backtesting, take real time to set up properly
Charts and Technical Analysis
TrendSpider’s charting includes 400+ pre-built indicators spanning trend, momentum, volume, volatility, and market breadth categories. Trendlines, Fibonacci retracements, and support/resistance zones are plotted automatically, which saves a real amount of manual work if you’re analyzing multiple instruments across sessions.
Multi-timeframe analysis lets you overlay indicators and patterns from a higher timeframe directly onto a lower-timeframe chart. You can plot the daily 5-period SMA on a 15-minute ES chart without opening multiple windows. Raindrop Charts are a proprietary chart type that shows volume distribution alongside price, giving you a clearer picture of where actual participation is happening.

Alerts are genuinely flexible. Dynamic alerts attach directly to trendlines, indicators, or levels on your chart. Multi-factor alerts combine several conditions into one trigger, so the alert only fires when everything lines up together. Cloud alerts run continuously even when your browser is closed, and all alerts can fire to webhooks, meaning you can route notifications to Discord, Telegram, Slack, or any service that accepts an HTTP POST.
Smart Checklists are a feature traders tend to overlook until they wish they hadn’t. You define a list of conditions that matter to your setup, and TrendSpider checks all of them automatically in a green/red format every time you load a chart. For a prop trader running NQ during an evaluation, having a pre-entry checklist that fires automatically is genuinely useful. Way cheaper than missing a check at the wrong moment.
The Dashboards feature lets you combine watchlists, mini-charts, scanner results, and data flow widgets onto a single customizable screen. If you want a proper command center view of your evaluation instruments rather than flipping between tabs, this is how you build it.
Beyond technicals, TrendSpider integrates a deep alternative data layer including corporate fundamentals, insider activity, dark pool and ATS volume, government trading disclosures, and Federal Reserve economic data (FRED), all accessible directly on your charts.
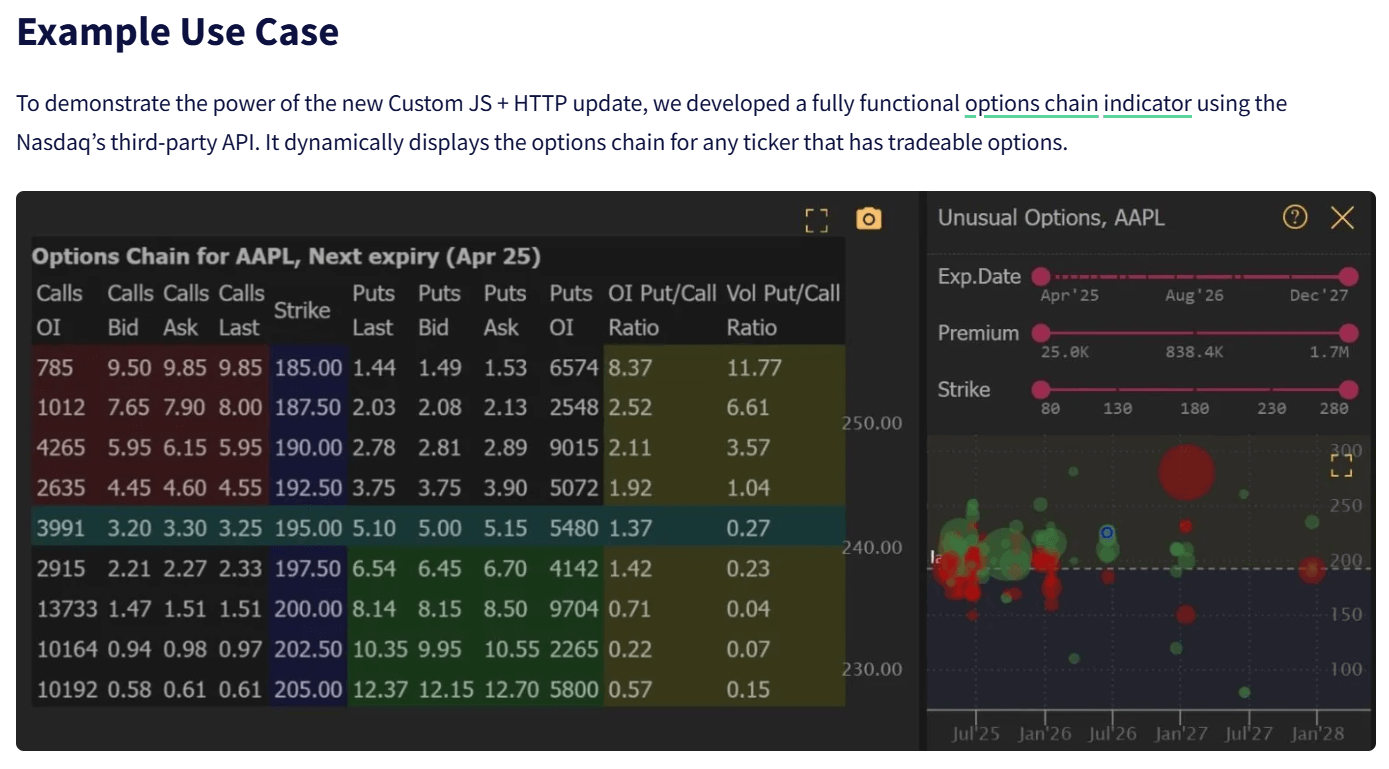
March 2026 added real-time US options data via OPRA, integrated across charting, scanning, watchlists, backtesting, and Smart Checklists. Two new panels came with it: an Options Chain view and an Options Map that visualizes Greeks, IV, OI, and volume as a heatmap across all expirations and strikes. It’s available as a paid add-on. For futures traders who use unusual options flow as a directional signal on ES or NQ setups, having that data native inside the platform rather than open in a separate window is genuinely convenient.
The options data also covers expected move, put/call ratio, and supports custom options indicators, giving you a more complete picture of market positioning directly on your charts.
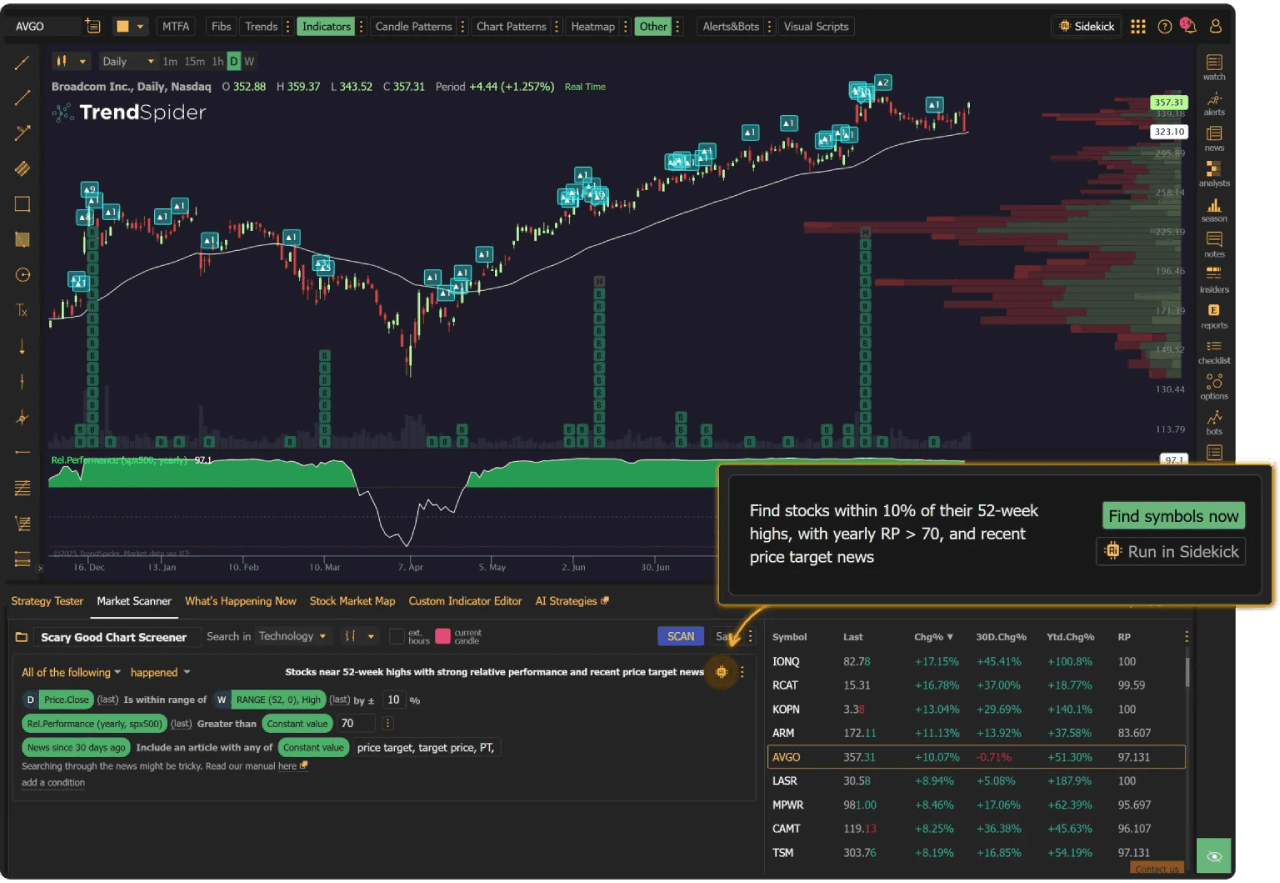
Human Language Scanning: Search Markets Like You Talk
Instead of building complex scan parameters and manually configuring filters, you just type what you want in normal language. “Find stocks in the S&P 500 trading near their 200-day moving average.” Results show up without any coding or parameter tweaking.
You can set scanners to run on a schedule too, so your morning setups arrive in your inbox before you even open the platform. Combine that with multi-timeframe scan logic, custom scan conditions, and the 700+ pre-built Smart Watch Lists that update automatically as market conditions change, and the scanner suite is genuinely impressive.
Sidekick takes scanning further with what TrendSpider calls agentic scanning. It doesn’t just run one search and hand you a list. It translates your request into parameters, runs the scan, evaluates the results, and refines the conditions automatically until it finds what you actually described. You can also tell it to “find more charts like the one I have open,” and it’ll search for similar setups across other instruments. That’s genuinely useful if you’ve spotted a pattern on ES and want to see if it’s showing up on NQ or YM too.
External API Integration
This one’s for the more advanced traders who want specific data that TrendSpider doesn’t provide natively. You can connect external APIs directly to the platform. Want CBOE market data? Social sentiment from X (Twitter)? News feeds from Benzinga? Pull it in and use it inside custom indicators and trading bots.
If there’s data out there that matters to your strategy, chances are you can integrate it and build tools around it.
AI Coding Assistant: Build Indicators Without Knowing Code
Here’s where things get interesting for traders who’ve always wanted custom indicators but don’t know how to code (which is most of us, let’s be honest).
The AI Coding Assistant lets you describe what you want in plain English, and it generates a custom JavaScript indicator for you. “Build an indicator that highlights the candle with the highest volume over the last 50 candles and paint it orange.” Or: “Build an EMA-band with a 7, 14 and 21-day EMA.” With a prompt like that, TrendSpider generates the entire JavaScript code with no coding knowledge needed. Don’t like something? Tell it to adjust. Those custom indicators can then be used throughout TrendSpider workflows, including charts, scans, alerts, backtests, and bots where applicable.
The April 2026 update introduced Sidekick Agentic Coding, which goes further. Instead of just generating code, Sidekick now opens the chart, runs the indicator, and evaluates the actual visual output against your request. If something’s off, it identifies and fixes errors automatically, iterating until the result is correct. That’s distinct from most AI coding tools that only check syntax. For complex, multi-step indicator builds, this is noticeably more reliable.
Strategy Tester: Backtesting Made Easy
Once you’ve found a setup worth testing, the Strategy Tester is where you put it under pressure. It’s TrendSpider’s no-code backtesting engine. You build your strategy with simple conditions, hit run, and see exactly how it would have performed. Candle depth varies by plan, from 2,000 candles on Standard up to 30,000 on Advanced, so if you’re planning serious intraday backtesting on 1-minute ES data, the plan tier matters more than you might expect.

The workflow is iterative. Start with a basic idea, maybe a MACD crossover. Add a filter like “only take trades when price is below the 50-day moving average.” Performance still has red flags? Refine the exit by adding an RSI condition. The performance chart shows winning trades in green, losing trades in red, right on the chart. The Price Behavior Explorer gives you granular data about how your trades behave, helping you figure out where to set stops before risking real money.
Performance metrics include Sharpe ratio, Sortino, win rate, average win and loss, reward-to-risk, maximum drawdown, and a full trade-by-trade log with equity curve. The KPI table is customizable and flags issues like low trade count or extreme drawdown with Go/No Go indicators. Results are also benchmarked against buy-and-hold and a randomized control, which helps you figure out whether your edge is real or just a function of being in a trending market. That benchmark matters more than traders usually expect.
The Variance Explorer lets you run backtests across multiple symbols and timeframes simultaneously. If you’ve built a strategy on ES, you can test it on NQ, RTY, and YM in one pass to see where it holds up and where it falls apart. For a prop trader who wants to understand how transferable their edge is, that’s a meaningful time saver.
AI Strategy Lab: Train Custom ML Models
This is different from the Strategy Tester, and the distinction matters.
The Strategy Tester is for no-code backtesting of rules-based strategies. The AI Strategy Lab trains custom machine learning models that generate predictive trading signals. You choose a prediction target (for example, whether a stock will close higher over the next N bars), define input features from TrendSpider’s data, and select a model type. Supported models include Random Forest, KNN, Naive Bayes, and Logistic Regression. No coding required at any stage.

Trained models can drive scans, alerts, rules-based strategies, or automated Strategy Bots. You can also backtest an AI-generated strategy the same way you would a rules-based one, which lets you compare approaches head-to-head before committing real capital.
Strategy Bots: From Backtest to Live Deployment
Once a strategy is backtested and you’re ready to run it forward, Strategy Bots deploy the tested logic as alerts or automated order-routing workflows. Because they’re position-aware, they track the full trade lifecycle from entry through exit, rather than firing isolated signals like a static alert.
Bots can send alerts via webhook, SMS, or email, or route orders through supported broker integrations via SignalStack. The March 2026 update renamed “Trading Bots” to “Strategy Bots” across the platform, which is a cleaner description of what they actually do.
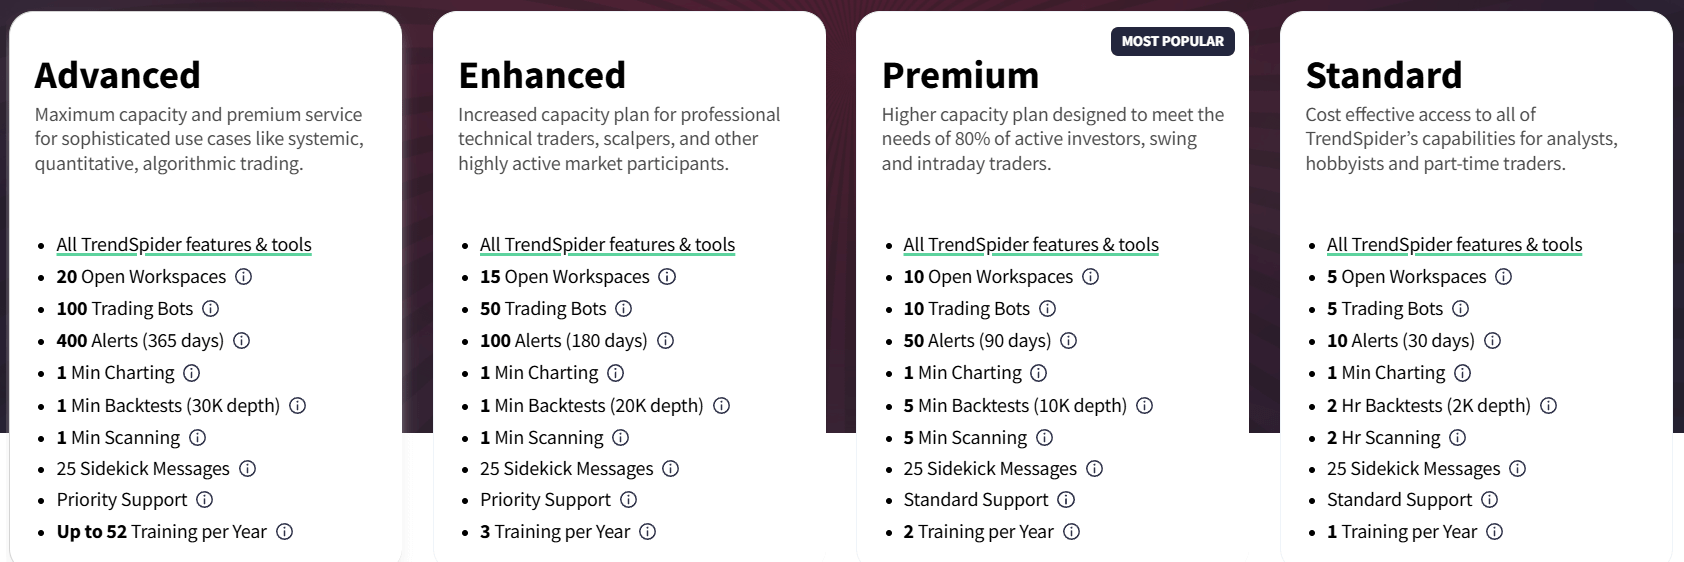
Alert, bot, workspace, and backtesting limits all vary by plan. The Standard plan runs 5 bots and 10 alerts. Premium bumps to 10 bots and 50 alerts. Enhanced gives you 50 bots and 100 alerts. Advanced goes up to 100 bots and 400 alerts. Worth checking the current plan comparison table for the full breakdown, since these numbers can change.
Paper Trading and Live Execution
Before going live, paper trading lets you test everything risk-free. Open the trading widget, connect a paper trading platform, and send trades to it for as long as you want. SignalStack is free in paper mode with unlimited signals, so you can run full bot workflows without committing real capital.
When you’re ready to flip the switch, live order routing runs through the Trading Widget and SignalStack workflow, connecting to supported brokers and exchanges. Supported brokers and compatible platforms can change over time, so check the SignalStack site and TrendSpider’s brokers directory for the current list before committing. It works well, but it’s worth being clear that this is a two-step setup, not single-platform execution.
Sidekick AI: Your AI Trading Assistant
Sidekick deserves its own section because it doesn’t fit neatly into any one part of the platform. It’s an LLM interface that runs across everything: charts, scanners, backtests, alerts, watchlists, and the AI coding environment. Think of it less as a feature and more as the layer that ties everything else together.
It has access to TrendSpider’s full data stack including price data, fundamentals, earnings, options flow, insider transactions, SEC filings, and earnings call transcripts. Unlike general AI tools, it can see your actual open chart, including its indicators, drawings, and timeframe, and analyze it in context. You can ask “what are the key levels on my chart right now?” and get an answer based on what’s actually on your screen, not generic market knowledge.
Sidekick is powered by frontier models from Anthropic (Claude), Google (Gemini), and OpenAI (ChatGPT). All plans include 25 free Sidekick messages per month. Beyond that, it’s a separate paid add-on ranging from $49/month for 100 messages up to $349/month for 1,000. Higher-tier paid plans also unlock additional model access. If you’re planning to use Sidekick heavily for research and scanning workflows, budget for this separately from your plan cost.
The April 2026 update added Sidekick Deep Research, which spins up a separate AI analyst for each symbol in parallel when you’re doing multi-stock research. Previously, analyzing 20 tickers in one prompt meant the AI lost context halfway through. Now each symbol gets its own analyst and results get combined at the end. That’s a meaningful workflow improvement for portfolio-level research.
Sidekick can also review your backtest results directly and suggest improvements. It analyzes entry and exit locations on the chart using machine vision, identifies errors or misconfigurations, and creates plain-English summaries of your tabular performance data. If you’ve stared at a backtest for an hour wondering why the Sortino is so low, having an AI interpret it for you and point to the problem trades is actually useful.
One thing worth flagging from the March 2026 update: Sidekick now shows its chain-of-thought reasoning by default, displayed in a visually distinct style separate from normal responses. So when it calculates a figure or arrives at a conclusion, you can see the steps it took to get there. That matters for a trading tool. Blind trust in an AI output is how you end up acting on a hallucinated support level.
Real talk: the 25 free messages per month goes fast if you’re using it properly. It’s not a dealbreaker, but it is a real cost consideration that the headline plan pricing doesn’t make obvious.
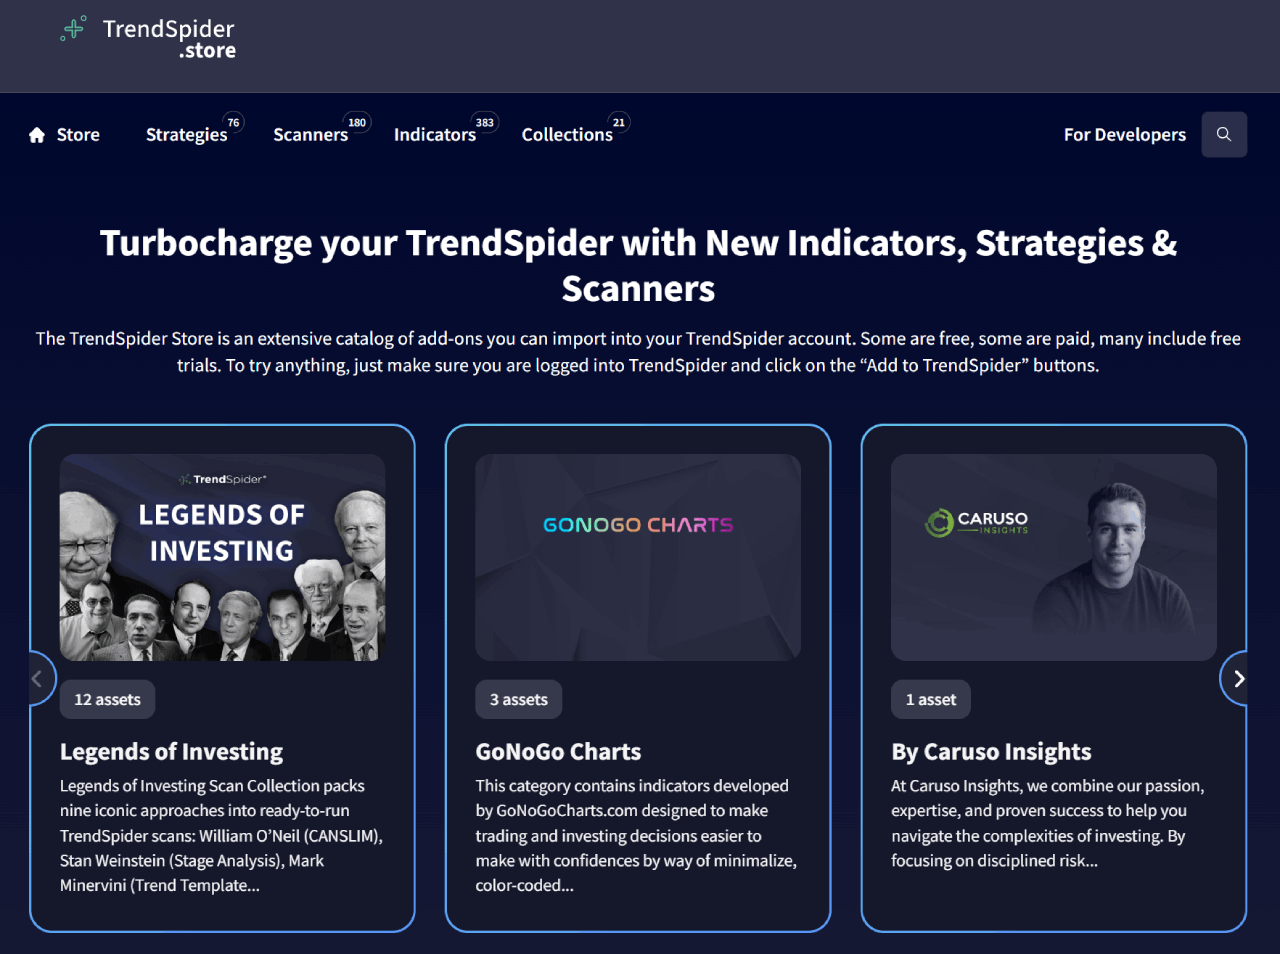
TrendSpider Store: Find Great Add-Ons
You can browse the store to find already-coded strategies, and there are plenty of free ones provided by TrendSpider itself. Investors who want to apply frameworks from Mark Minervini, Joel Greenblatt, Nicolas Darvas, Warren Buffett, Richard Dennis, Peter Lynch, Stan Weinstein, Ben Graham, or William O’Neil can find those indicators and scans in the store and apply them directly, no coding needed.
For futures prop traders specifically, the February 2026 ORB collection is worth knowing about. It includes an indicator that automatically paints the opening range on your charts, a real-time scanner for live ORB setups, and a fully automatable strategy bot. Opening range breakout is one of the most commonly traded intraday strategies on ES and NQ, and having the whole workflow pre-built and ready to deploy is a decent time saver if that’s part of your playbook.
There’s also an opportunity to monetize your own builds. If you’ve built something useful with the AI Coding Assistant, you can publish it to the TrendSpider Store, set a price, and TrendSpider handles payment processing. The submission goes through a review to confirm it works correctly, and if approved, it becomes discoverable by other users. Good way to offset your subscription costs if you build something genuinely useful.
Education
The platform can feel overwhelming early on. TrendSpider seems aware of this and does a decent job of addressing it. There’s an extensive resource library on their website, a well-maintained YouTube channel, and TrendSpider University for structured learning. Depending on your plan, you get between 1 and 52 one-on-one training sessions per year for free, which is unusual and actually useful for a software subscription at this price point.
Who Should Use TrendSpider
Futures traders who need to scan, chart, and backtest the same instruments they’re actually trading in a prop firm evaluation are the clearest fit. If you’re running strategies on ES, NQ, MES, or MNQ through an evaluation at TradeDay or Earn2Trade, TrendSpider gives you the tools to build and stress-test those strategies on real historical data before risking evaluation capital.
Systematic traders who want to automate analysis and signal generation without writing code also belong here. The backtest depth, AI strategy tools, and bot deployment pipeline are genuinely competitive. If you’re spending hours each week manually building and checking watchlists, the scanner suite alone probably justifies the cost.
Who Should NOT Use TrendSpider
If you’re purely a price action trader who works off clean charts with no indicators, TrendSpider is probably overkill. You’d be paying $80+ a month for automation you’ll never touch.
Traders who execute high-frequency strategies or need direct market access with ultra-low latency should look elsewhere. TrendSpider is an analysis and signal platform. The gap between spotting a setup and getting into a trade still runs through a separate broker.
Beginners who haven’t yet developed a consistent manual process will likely get lost here. The platform rewards traders who already know what they’re looking for and want to automate the hunt. Starting on TrendSpider before understanding trendlines, timeframes, and basic scanning logic is like buying a professional espresso machine before knowing how to make coffee.
And if budget is a real constraint, TradingView’s free or lower-tier plans cover charting basics adequately. TrendSpider’s value is in the automation layer. If you won’t use it, save the money.
TrendSpider Pricing Plans 2026
TrendSpider has four individual plans (Standard, Premium, Enhanced, Advanced) with monthly, quarterly, and annual payment options.
I wrote a separate guide on how to use the 30% TrendSpider coupon PROP30. The guide explains in detail how this code combines a 14-Day risk-free trial with a 30% discount, plus another ~35% in savings on annual plans (normally, you either choose the 14-day trial, but then without a discount, or you choose the discount, but then without a trial period).
| Plan | Monthly Plan | Quarterly Plan | Yearly Plan |
| Standard | $82 | $225 ($75/m) | $648 ($54/m) |
| Premium | $149 | $378 ($126/m) | $1,092 ($91/m) |
| Enhanced | $199 | $501 ($167/m) | $1,464 ($122/m) |
| Advanced | $349 | $882 ($294/m) | $2,568 ($214/m) |
TrendSpider also offers a Business plan starting from $399/month for teams and trading desks, with multi-user support, volume discounting, and a dedicated account manager. Contact their sales team for details.
Annual plans save around 35% compared to twelve monthly payments (+30% with our code PROP30). All plans include all TrendSpider features, but limits on bots, alerts, workspaces, backtest depth, and scanning timeframes vary significantly by tier. Standard is restricted to 2-hour backtests with 2K candle depth, while Advanced supports 1-minute backtests with 30K depth. If you’re planning to run systematic intraday strategies on NQ or ES, Standard is going to feel limiting fast.
Real-time futures data from CME, NYMEX, COMEX, and CBOT costs an extra $7.50/month for non-professional users on top of any plan. U.S. equity real-time data is free for non-professionals, but futures isn’t. Worth factoring that into your actual monthly cost before you subscribe.
The 14-day trial costs between $5 and $49, depending on the current promotion and plan.
The plans differ meaningfully in monthly usage allowance across bots, workspaces, alerts, backtest depth, scanning timeframes, and training sessions. Check the current plan comparison on their pricing page for the full breakdown.
Alternatives to TrendSpider
Day traders who want real-time data, 10+ charts open simultaneously, and a focus on market scans should consider Trade Ideas. They also have AI interactions, backtesting capabilities, trading signals, paper trading, and brokerage connections.
TrendSpider vs. Trade Ideas vs. TradingView
| Feature | TrendSpider | Trade Ideas | TradingView |
|---|---|---|---|
| AI features | Sidekick LLM, AI Coding Assistant, AI Strategy Lab | Holly AI, Money Machine (Premium only) | Limited, Pine Script community indicators |
| Backtesting | Yes, up to 30,000+ candles, no coding needed | Yes, via OddsMaker | Basic bar replay, limited vs. the others |
| Futures support | Yes, full U.S. futures coverage | No, U.S. equities focused | Yes, but real-time futures data costs extra |
| Market scanning | Technical, fundamental and alternative data, AI-assisted, scheduled scanners | Real-time stock scanner, U.S. equity momentum focused | Limited on lower plans, no AI-assisted scanning |
| Free plan | No, $19 trial only | Yes, delayed data | 30-day free trial |
| Best for | Futures traders, systematic traders, prop firm prep | U.S. equity day traders, momentum scanners | Beginners, community-driven traders, forex |
| Monthly pricing | $82 – $349/month | $127 – $254/month | $14.95 – $239.95/month |
| Annual pricing | $648 – $2,568/year | $1,068 – $2,136/year | $155.40 – $2,399.40/year |
Final Thoughts
TrendSpider is one of the better analysis platforms available right now, and it’s not for everyone. If you trade futures, stocks, or crypto, run systematic strategies, and spend real time on chart analysis and backtesting, this platform will likely become a core part of your workflow. The AI layer is genuinely useful, not just a marketing feature, and the backtesting depth is hard to find elsewhere without writing code.
If you’re a pure price action trader who hates indicators, a trader still building a consistent process, or a buy-and-hold investor, the cost and complexity will work against you. TradingView at a fraction of the price covers the basics well enough until you’re ready for something more.
So the decision is pretty simple: if technical analysis and strategy development are central to how you trade, TrendSpider is worth it. If they’re not, save the money.
FAQs
Is TrendSpider worth it?
Yes, for active traders who rely on technical analysis. The automation layer, Sidekick, and backtesting depth justify the price if you’ll actually use them. If you’re a retail trader or just need basic charting, the cost is harder to justify compared to cheaper alternatives like TradingView and Finviz.
Is there a TrendSpider free trial in 2026?
No. TrendSpider no longer offers a free trial. Instead, there’s a 14-day full-access trial starting at $19, which covers all features on any plan. It’s enough time to run real backtests, explore Sidekick, and figure out whether the platform fits your workflow before committing to a monthly or annual subscription.
What is the TrendSpider refund policy?
Trials and first-period subscriptions are not refundable. You can cancel your subscription renewal via email, telephone, or chat. If you missed the cancellation window, you can request a refund within 72 hours of renewal.
Does TrendSpider support futures trading?
Yes. TrendSpider covers CME Group and ICE futures, including ES, NQ, CL, GC, RTY, YM, and the micro contracts. Real-time futures data is available as an add-on for $7.50/month for non-professional users. Delayed data is included by default. Verify exact data access and instrument coverage against your plan before subscribing.