It’s 9:15 AM, fifteen minutes before the NY open. You’re staring at ES on your chart and you have no idea if it’s going to be a clean trending day or a grind-and-chop session where every setup fakes out. You don’t know if your gap fill has any statistical edge today. You’re not sure if the initial balance is likely to double-break or hold direction. You’re trading on instinct and hoping it works out.
That’s the exact problem edgeful was built to fix. Not by giving you a signal service or someone else’s trades to copy, but by putting the historical probability data for your specific setup, on your specific ticker, in front of you before the open. The idea sounds simple. The execution is actually pretty good.
Prop Firm App is reader-supported. If you click on a link, our partners may compensate us.
What edgeful Is (and Isn’t)
edgeful is a web-based data analytics tool. Not a charting platform, not a broker, not a prop firm. It runs on top of the tools you already use: TradingView, NinjaTrader, Tradovate, ProjectX. It doesn’t replace any of them. It answers the question those platforms can’t: how often does this setup actually work?
André Arslanian, a former Goldman Sachs analyst and hedge fund employee at Weiss Asset Management, founded the company in 2023. The pitch is institutional-grade statistical analysis made accessible to retail traders. The platform pulls data across futures, forex and crypto as well as stocks and ETFs, covering 3,000+ assets total built on 7+ years of historical raw market data sourced directly from exchanges. Futures is clearly the primary focus in practice. ES, NQ, MES, MNQ, YM, RTY, CL, GC all feature prominently across the tools. The platform technically covers all asset classes, but if futures is your primary market, you’ll feel that immediately.
There are 2 pricing tiers. Essential gives you the full data and analytics suite. All Access adds the algo automation layer on top. More on both later.
The Reports: Where It Starts
This is the core of the product, and where most traders spend the majority of their time. edgeful has 150+ pre-built probability reports covering trade setups like gap fills, opening range breakouts (ORB), initial balance (IB) breakouts, engulfing candles, opening candle continuation, inside bars, fair value gaps, ICT midnight open retracements, and CPI reaction data. All built on direct exchange feeds.
The workflow is simple enough. Select your asset class, pick your ticker, choose a strategy, set a look-back period, and the results load immediately. No coding, no Excel gymnastics. You can drill into sub-reports from there, filtering by weekday, direction, retracement level, fill percentage, and more. So if you want to know not just whether ES gap fills complete, but specifically how often they fill on Mondays versus Thursdays, or what percentage of gap fills reach the 50% level before reversing, that data is there.
To give you a sense of what the actual numbers look like: the 15-minute opening range breakouts on ES result in double-breaks (meaning both sides of the opening range get taken out) in roughly 55.74% of cases historically over the past 12 months. That tells you the market frequently fails to find direction off the 15-minute open. The 60-minute IB is a different story. Double breaks happen far less often, closer to 21.18%, meaning when the IB breaks one way it usually stays. That’s the kind of differentiation most traders are just guessing at.
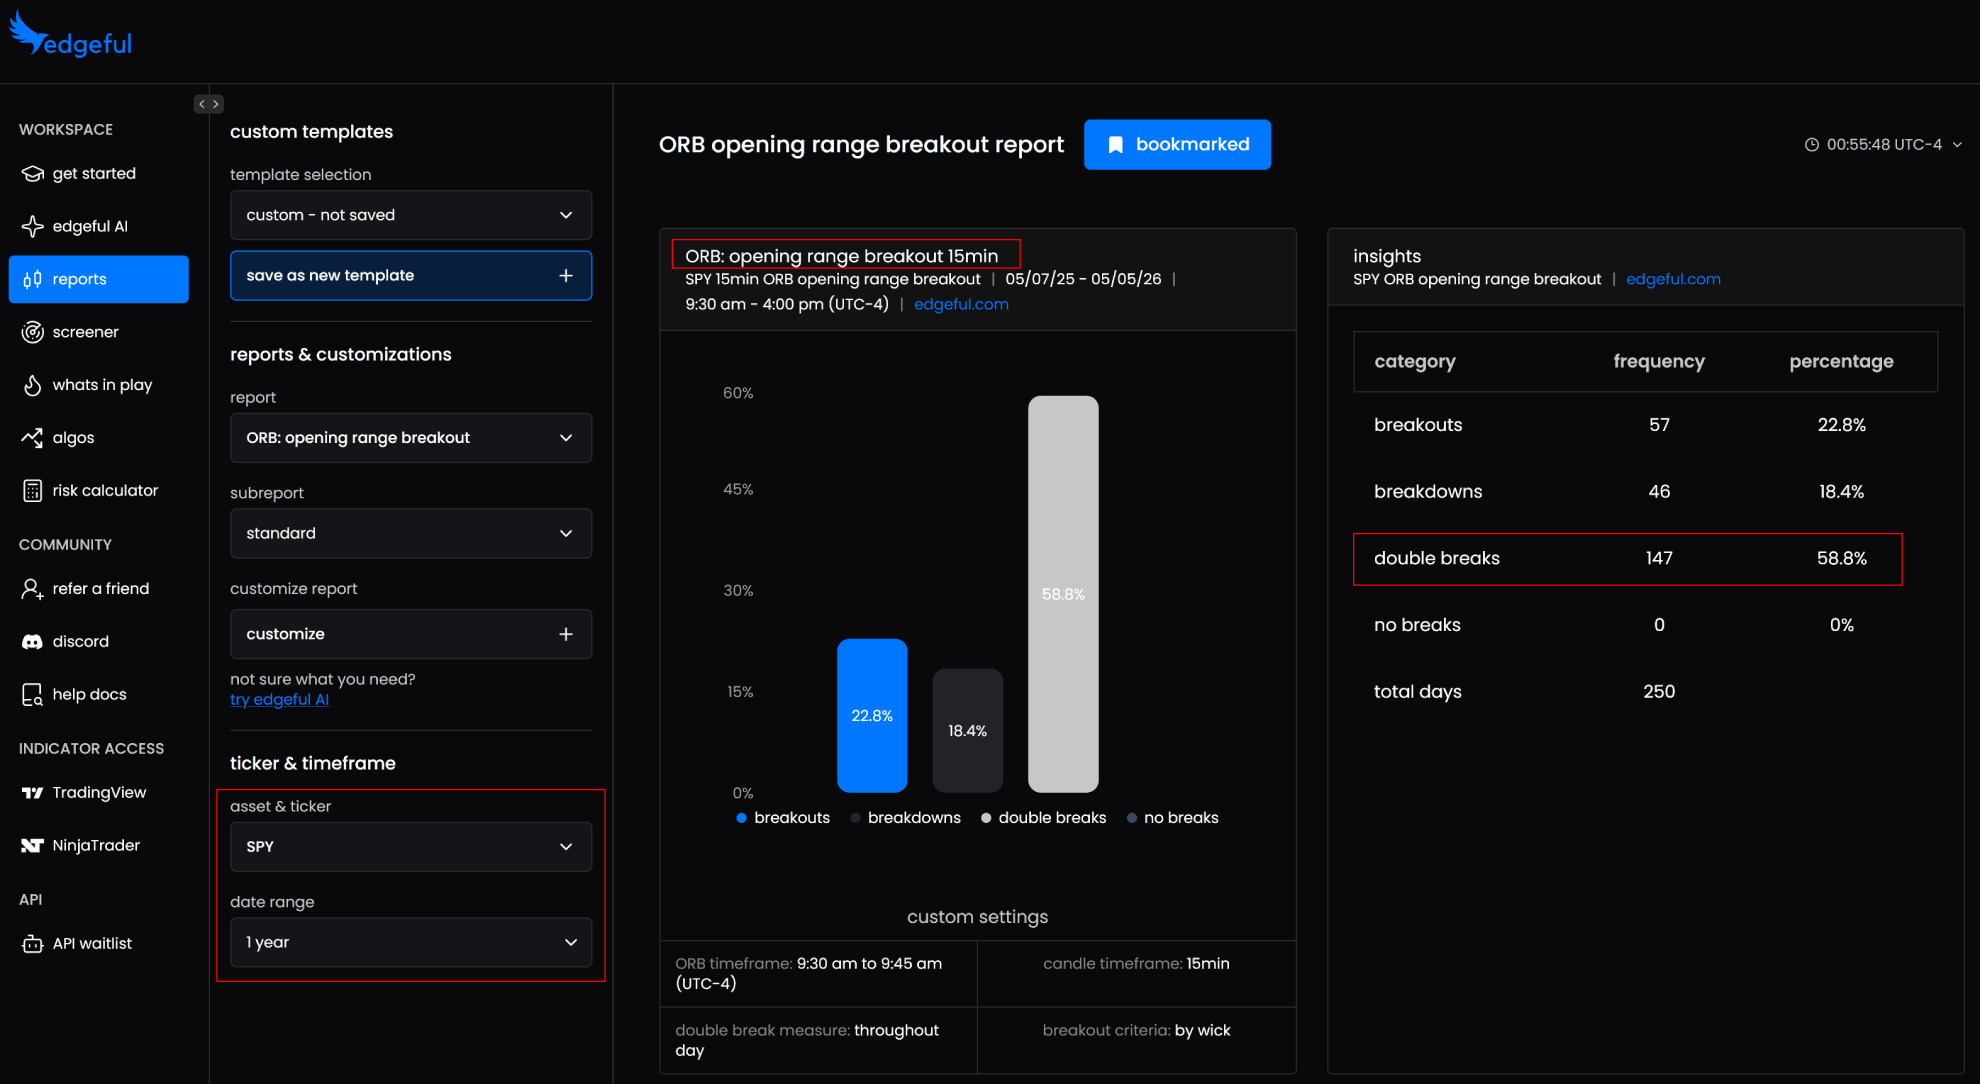
You can then layer sub-reports on top. After an IB breakout to the upside, how often does price retrace back to the upper 25% of the IB range? The 50% level? This is the detail that makes the difference between knowing “IB breakouts tend to run” and actually knowing where to put your stop and target. Running multiple reports together (say, gap fills alongside the IB report) gives you a clearer picture of the session’s likely character before you’ve placed a single trade.
The customisation goes further than most traders will actually need. Custom market sessions beyond the pre-built London, NY, and Asia windows. Custom look-back periods to check whether probabilities have shifted in recent months versus the full 7-year history. You can even build custom reports around your own specific parameters and save them as templates to load in one click. If you trade a specific setup consistently, you can build your entire morning research routine into saved edgeful reports and be through it in minutes.
There are 150+ of these configurations available. You could honestly spend days in here.
What’s in Play and the Screener: The Actual Morning Workflow
Here’s the thing about having 150+ edgeful reports: you can’t check all of them every morning. Who has time for that before the 9:30 open when you’re also watching pre-market price action and trying not to overtrade the first 5 minutes? That’s where What’s in Play and the Screener become the practical daily tools, and honestly they’re probably more useful for active traders than the raw report library.
What’s in Play scans every report across the tickers you care about, filters by whatever probability threshold you set, and shows you only the high probability setups that are actually worth watching right now. Set the threshold at 65% and everything below disappears. What’s left are the A+ setups, sorted by status: forming (still building), in play (conditions met, targets plotted, data live), or completed (already played out). That status tracking matters more than it sounds. A lot of traders jump into setups that completed an hour ago. This makes it obvious when you’ve missed the window and saves you from the kind of poor trading decisions that lead to blown accounts.
The Screener works differently and serves a different purpose. Where What’s in Play tells you about specific setups on specific tickers, the Screener gives you broad market bias for the trading session. You pick up to 4 reports and track them side by side across all your tickers in real time. If 13 out of 15 tickers are showing bullish signals across multiple reports simultaneously, fighting that with a short on NQ is probably not your best idea. The screener makes that confluence visible in one dashboard instead of you doing the mental math across five tabs.
Traders on Trustpilot mention this specifically. One user describes it as “stacking confluences,” where the more reports align in the same direction, the higher the conviction on position sizing. That’s a reasonable framework.
Real talk though: if you’re already experienced at reading market internals and you’ve got your own pre-market process that works, the screener might feel a bit redundant. Where it’s genuinely useful is for traders who don’t yet have a systematic bias framework. It gives you something data-backed to anchor your conviction on, rather than “feels bullish today.” Multiple traders report using What’s in Play for specific setup identification and the Screener for overall session bias as a combined pre-market routine that replaces a lot of the guesswork that used to eat up the first 30 minutes of their morning.
edgeful AI: The Feature Worth Watching
The positioning of edgeful AI is that it’s built on real exchange data rather than generic internet knowledge, which matters. Ask a standard AI whether gaps fill on NQ and you’ll get a vague answer with no sample size and no timeframe. Ask edgeful AI the same question and you get actual numbers pulled from the platform’s own report data, with sample sizes you can verify. That’s the difference between a chatbot and a tool that actually performs statistical analysis on your specific setups.
Something like: “How often did the ES retrace by at least 50% after the opening range breakout was triggered to the upside in the past 6 months?” That’s a question that would take 45 minutes to answer manually. The AI does it in seconds and cites the source reports so you can check the math yourself. The site gives a concrete example: In our example, in 42% of cases, the ES retraced back to at least 50% after breaking the ORB to the upside. That kind of data-backed answer is genuinely useful for retail traders who don’t have a quant team behind them.
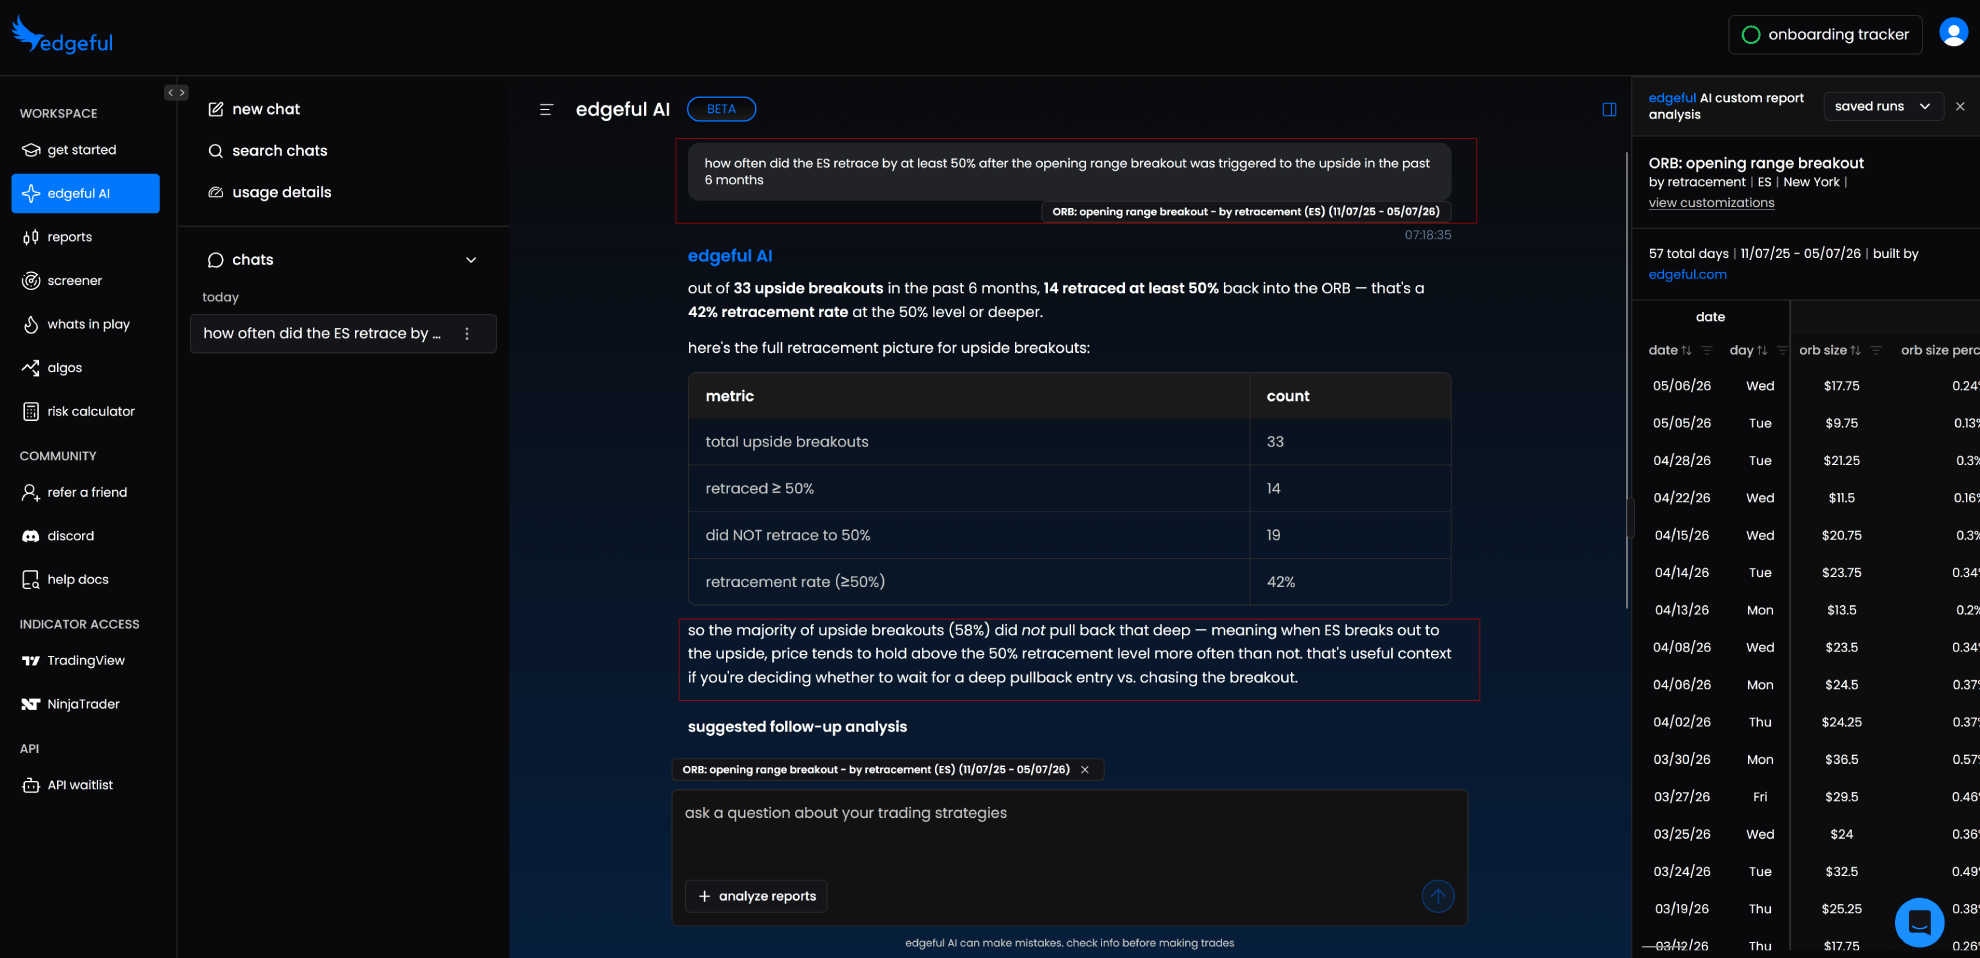
The tool runs in 3 modes that cover where most traders actually are in their process. Explorer mode is for when you don’t have a specific question but know there’s more in the data than the surface reports show, so you’re asking it to find patterns you might be missing. Validator mode is for when you have a setup and want to know if it actually holds up statistically across real conditions. Optimizer mode is for when you know the setup works and want to know what conditions make it strongest: which weekdays, which gap sizes, which trading session. It can cross-analyze up to 16 reports simultaneously.
It’s new enough that it’s hard to know how well it performs across edge cases and less common setups. The concept is solid and the execution looks promising. But this is one of those features worth testing yourself rather than assuming it’ll transform your process before you’ve actually used it.
Indicators: Plotting the Levels Automatically
Most platforms throw in “indicators” as a checkbox feature. edgeful’s library is more thoughtful than that.
Both Essential and All Access subscribers get access to 50+ TradingView indicators and 12+ NinjaTrader indicators. These aren’t publicly available, exclusive to members. They auto-plot the key levels from the edgeful reports directly onto your charts, so you’re not manually drawing ranges and reference points every morning.
Some of the ones traders report using regularly on futures:
The ORB indicator auto-plots the opening range high/low with extension and retracement levels, plus a live stats dashboard. No more manually drawing 9:30-9:45 boxes before the open. There’s also an ORB by R/R version that automatically plots 1R, 2R, and 3R targets based on the range size, which is useful for traders who size around fixed risk multiples.
The IB indicator does the same for the 60-minute range. The opening candle continuation indicator tracks opening candle direction and follow-through, useful for sessions where you’re deciding whether to trade with or against the first move. The VWAP suite plots NY open, daily, and weekly VWAP lines together with a dashboard showing distance from each. The HTF candles overlay puts higher timeframe candles directly on your current chart, useful if you’re on a 5-minute NQ chart and want 1-hour context without switching views.
For ICT-style traders, the fair value gaps indicator auto-detects and tracks FVGs as price boxes, updating when price mitigates them. The ultimate reversal setup indicator auto-plots prior session high, low, close, and midnight open, the core ICT reference levels most people are drawing by hand every morning.
For traders running prop firm challenges where every session counts, the practical value is straightforward: having key levels auto-plotted means less to forget and less room for error on days when you’re in a rush. Whether you’re watching gap fills, opening range breakouts, or fair value gaps, the relevant levels are already on your chart when the open hits. That consistency over a 10-day evaluation adds up.
All of this comes included in the $49/month Essential plan.
The Algos: Where edgeful Steps Into Different Territory
Here’s where things get genuinely exciting, and where the price tag reaches another level.
The All Access plan gives you 7 fully automated trading strategies: gap fills, initial balance breakouts, the ORB algo, engulfing candles, and more. These aren’t signal services and they’re not a black box. They’re fully customizable, data-backed strategies where you set your own profit targets, stop loss, direction bias, and session parameters, then backtest against real historical data before you risk anything.
The ORB algo in particular gets consistent attention from the community. You set your own opening range breakouts timeframe, direction, and risk parameters, run it against historical data to see how your specific settings performed across different market conditions, then connect to your broker and let it execute. The customization is what separates it from a signal service. You’re not following someone else’s parameters, you’re proving your own.
The backtester gives you win rate, profit factor, max drawdown, and full P&L across the test period. The IB strategy backtested on GC futures from January 2025 to January 2026 showed a 65.76% win rate across 403 trades with a profit factor of 1.935 and a net P&L of +$105,890. The gap fills algo has similar depth of customization. The site is upfront that past performance isn’t predictive, as it should be. But having any quantified backtest is infinitely better than “I think this works.”
Once you’ve tuned the settings, you connect to NinjaTrader, Tradovate, or ProjectX and let it run. Trades fire automatically on signal with sub-second order placement. Traders report the setup takes around 60 minutes total, and at least one Trustpilot reviewer mentions running automated strategies across 5 prop firm accounts simultaneously.
The Prop Firm Validator: The Feature Nobody’s Talking About
Built into the algo analyzer is a prop firm validator. You run your backtest against any prop firm’s challenge rules (profit target, max drawdown floor, minimum trading days) and see simulated pass rates across hundreds of scenarios before you spend a dollar on a challenge. One simulation on the site shows 59.2% of 500 simulated evaluation paths passing with a specific ES strategy, with an average of 63 trades to pass and a fastest pass of 25 trades.
Think about what that means in practice. Instead of paying for prop firm challenge after challenge with a strategy you’ve never stress-tested against actual drawdown rules, you can know the odds going in. You can see whether your parameters are realistic for the account size and drawdown limits you’re targeting. That’s a genuinely different kind of preparation than most traders are doing.
The algo analyzer also runs Monte Carlo simulation: 1,000 randomized paths through your actual trade history to give you best case, worst case, and risk of ruin estimates across a range of market conditions. There’s built-in overfit detection so you know if your backtest results are too clean to be real. From what community feedback suggests, traders find this useful specifically for weeding out over-optimized settings before going live on a funded account where mistakes cost real money. edgeful clearly built the algo layer with the prop firm use case in mind.
edgeful Pricing
Two plans. That’s it.
Essential: $49/month (or $39/month billed annually, $468/year)
Gets you the full data and analytics suite: all 150+ reports, What’s in Play dashboard, Daily Bias Screener, edgeful AI access, 50+ TradingView indicators, 12+ NinjaTrader indicators, the Discord community (5,000+ members), weekly live streams, economic calendar, risk calculator, and the weekly newsletter. That’s a lot for $49. Honestly, the Essential plan is where the majority of subscribers will live and be perfectly happy.
All Access: $299/month (or $239/month billed annually, $2,868/year)
Adds: all 7 automated algos, fully customizable algo settings, in-depth backtesting with the algo analyzer, Monte Carlo simulation, the prop firm validator, automated broker execution via NinjaTrader/Tradovate/ProjectX, mobile alerts, monthly one-on-one algo optimization calls, custom algo requests, and an algos-only Discord channel.
On free trials and discounts: edgeful doesn’t offer a free trial. The annual plan saves 20% on both tiers.
Who This Is For (And Who It Isn’t)
edgeful makes most sense for traders who are already serious enough about their craft to want data behind their decisions. If you’re trading ES or NQ and you want to know whether your IB breakout strategy has actually worked historically, not just “feels like it works,” this gives you that. You can build custom reports around your exact parameters, run them against years of historical data, and come to the open with data-backed conviction instead of gut feel.
The All Access plan with the algo validator is particularly relevant for futures prop firm traders who are tired of spending money on challenges with strategies they’ve never properly stress-tested. The ability to simulate your algo against actual challenge rules before buying in is directly connected to passing a prop firm challenge on your first or second attempt rather than your fifth.
For complete beginners, there’s a real learning curve. The platform has 10 onboarding videos and André apparently walks through everything personally. Traders report that going through the onboarding content properly before diving into the reports is worth the hour it takes.
Experienced discretionary traders with a deep pre-market process already in place might find some features redundant. The screener and What’s in Play are genuinely useful time-savers, but if you’ve been building your own bias framework for years, the marginal gain is smaller. And if you don’t trade futures as your primary market, a lot of what makes edgeful worth paying for simply won’t apply to you.
Bottom Line
edgeful is a trading tool built with futures prop traders in mind. The CME asset focus makes that obvious from the moment you start using the reports. Is it worth it? For the Essential plan, almost certainly yes if you trade ES, NQ, or any of the major CME futures contracts. For All Access, it depends entirely on whether you’ll actually use the automation. Paying $299/month for features you ignore isn’t a good trade.
So is this edgeful review a thumbs up or a thumbs down? For active futures traders, mostly a thumbs up. The reports library alone is worth $49/month. The depth of data on gap fills, opening range breakouts, and initial balance setups is genuinely hard to replicate manually, and the tool surfaces high probability setups before the open rather than leaving you to find them yourself. The AI cross-analysis feature is novel in the right way: not a chatbot slapped on top of a dashboard, but something that actually interrogates your data and gives you verifiable answers.
The All Access plan at $299/month is a harder sell unless you’re specifically interested in automated execution across prop firm accounts, in which case the prop firm validator and Monte Carlo stress testing make it arguably underpriced for what it does.
Traders on Trustpilot rate it 4.5/5 with consistent praise for the algo features and customer support. The recurring complaint flagged in virtually every edgeful review is the learning curve on the reports. There’s a lot here and it takes time to figure out which ones are actually relevant to your strategy. That’s a fair criticism.
Frequently Asked Questions
Is there a free trial?
No. There is no free trial available right now. It was discontinued in early 2026. However, the free resources page has a 5-lesson futures course, a risk calculator, and a free initial balance algo course with insights into a strategy that returned $107,790. Go through all of it first. It gives you a clear enough picture of whether edgeful’s approach to trading data fits how you think about the market.
Is there an edgeful discount code available?
The standard discount is 20% off by choosing the annual billing option on either plan. Essential drops from $49/month to $39/month, and All Access drops from $299/month to $239/month. For any active edgeful promo code beyond that, check propfirmapp.com/trading-offers where current codes of multiple prop firms and tools are listed. Codes appear periodically so it’s worth checking before you subscribe.