Our Take on Finviz
Whenever I check quotes of U.S. stocks, Finviz is my top choice. That’s because compared to other free screeners and charting tools, they have the least amount of ads and no time limits when using the free version. Only if I need to check international stocks, or when I like to use drawing tools for detailed chart analysis, I switch over to TradingView.
Prop Firm App is reader-supported. If you click on a link, our partners may compensate us.
My Opinion about Finviz
Finviz is the best free stock screener for swing trading and investing. You can quickly check charts, stats, and news for all US stocks with delayed market data. Using the paid Finviz Elite features is entirely optional. Finviz Elite comes with real-time market data (including pre- and post market), advanced charts and analysis tools, export functionalities, and more convenient layouts, portfolios, and backtesting. The free account with email registration has the best value, and for Finviz Elite, the annual plan with over 36% in savings vs. monthly payments is the best way to go after having intensively tested the tool with the free account.
The benefits of Finviz don’t stop with the free version. They also have a paid plan called Finviz Elite, which comes with advanced charting, extended hours quotes, correlation analysis, backtesting and advanced scanners.
What do I like about Finviz Elite the most? It’s the speed. The speed amazes me. No matter if I open the Elite charts, news, screener or other tools, I click on it and see the results in a fraction of a second. No loading times, no layout shifts, and no complicated things. Just straightforward and easy to use. In this review, I’ll share my thoughts about the free and paid plans, explain the costs, talk about the benefits and how Finviz compares to competitors.
Try Finviz Elite 7 days for free, register for a free account, or save 36% with annual plans.
Platform Features
Finviz Market News
The market news tab features news from leading media like MarketWatch, CNBC, Bloomberg and Reuters and lists them in chronological order across all sources, or by each source. You can narrow down the news feed to stock news, ETF news and Crypto news if you like.
Finviz Stock & ETF Screener
The stock and ETF screener is the bread and butter of Finviz and Finviz Elite. Here you can filter stocks and ETFs with up to 98 filter types like Exchange, Market Cap, Operating Margin, Opening Gap, Net Profit Margin, Performance, Candlestick types, Return on Assets, Volatility, Short Float, After-Hours trading and more.
Each screen can be saved individually and you can export all the data you use. The refresh intervals of the screener are either 10 seconds, 1 minute or only with manual refreshes.
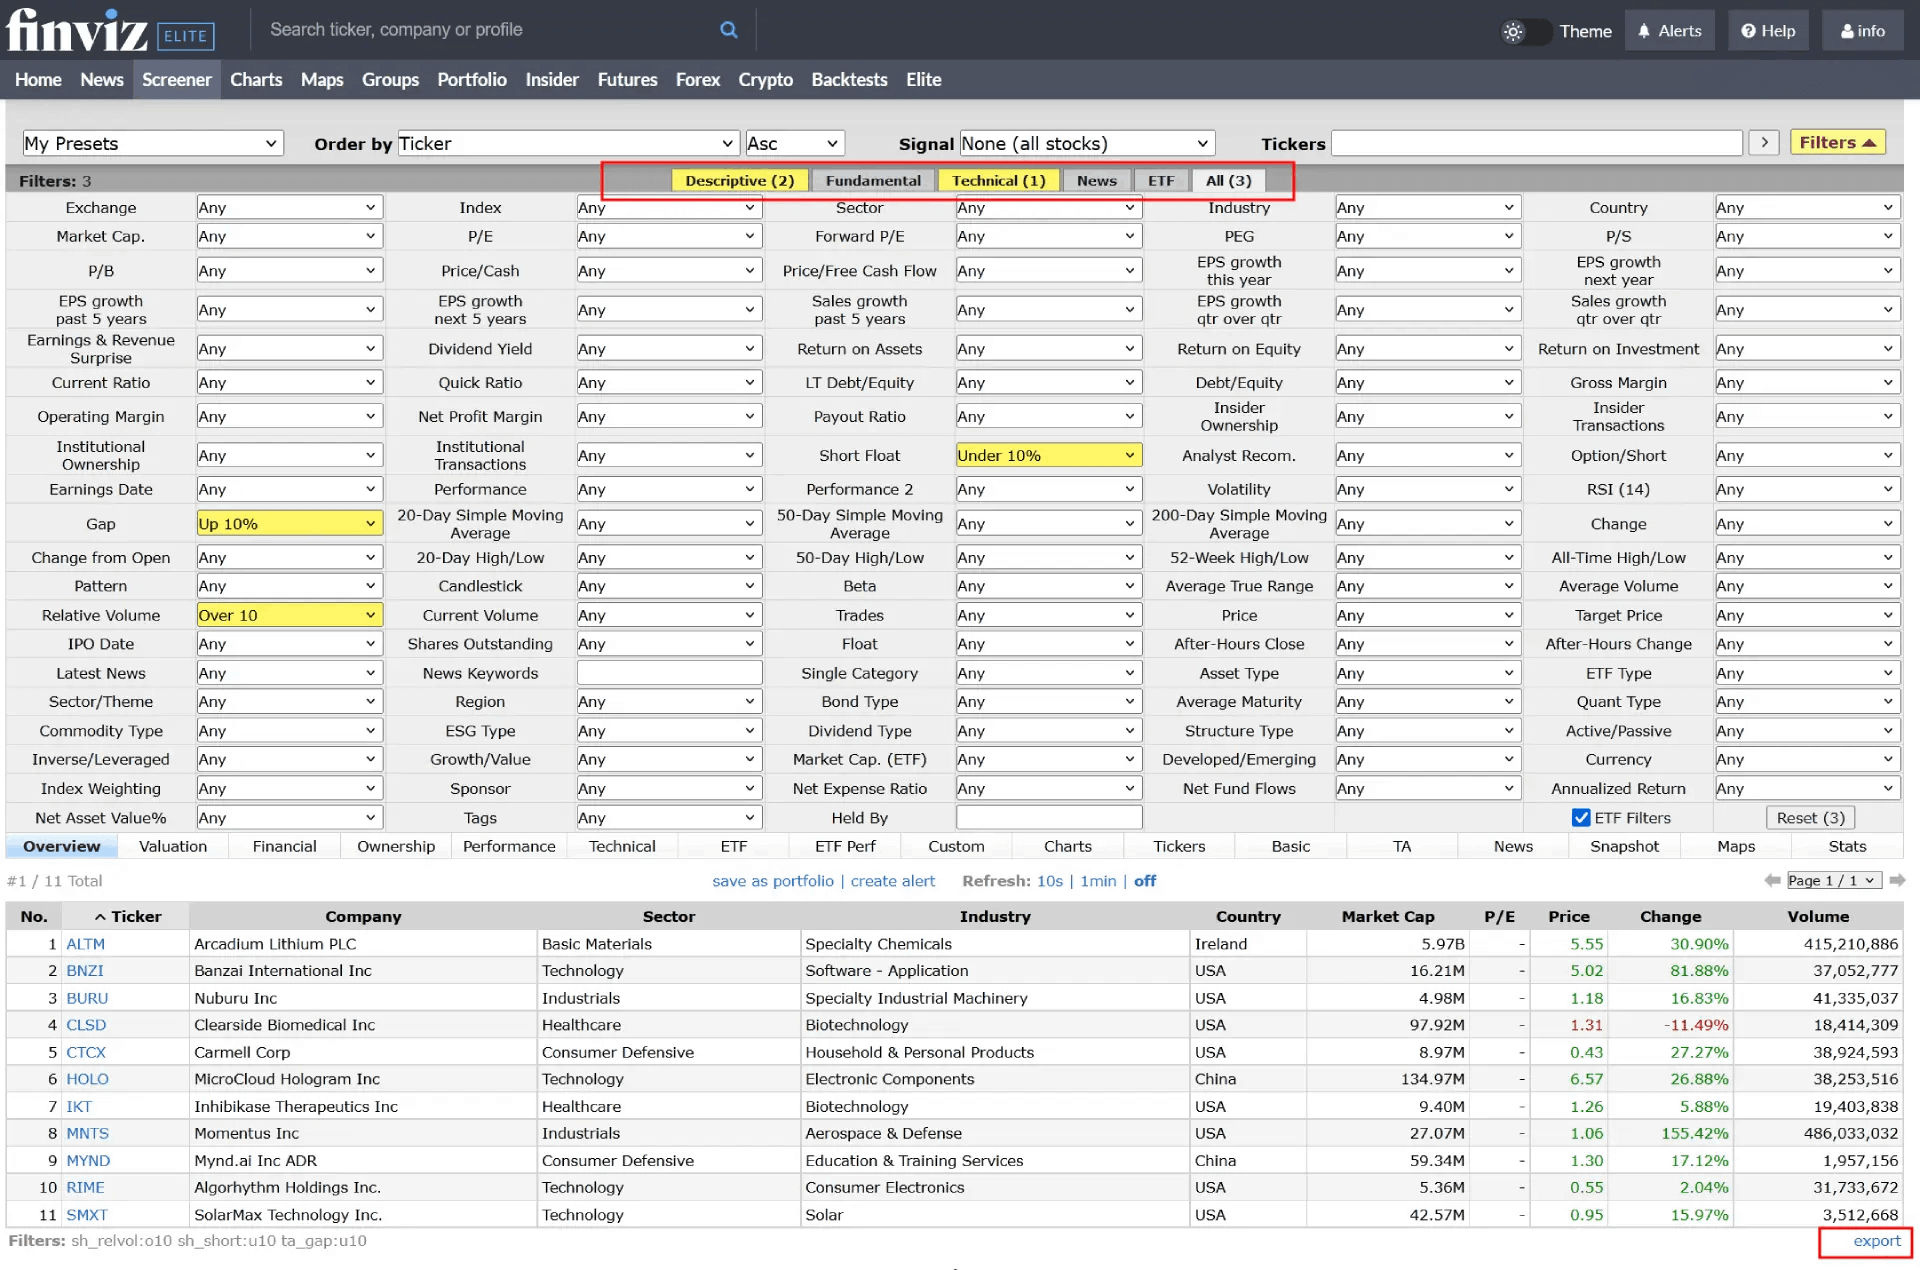
I think the screener UI is described best as advanced Excel mode with up to 98 columns to evaluate, extract, download, sort and filter across the board of over 8,500 U.S. listed stocks and even more ETFs.
Charts
If you use the free Finviz version, there is only one chart, everything is with delayed quotes and there are no drawing tools.
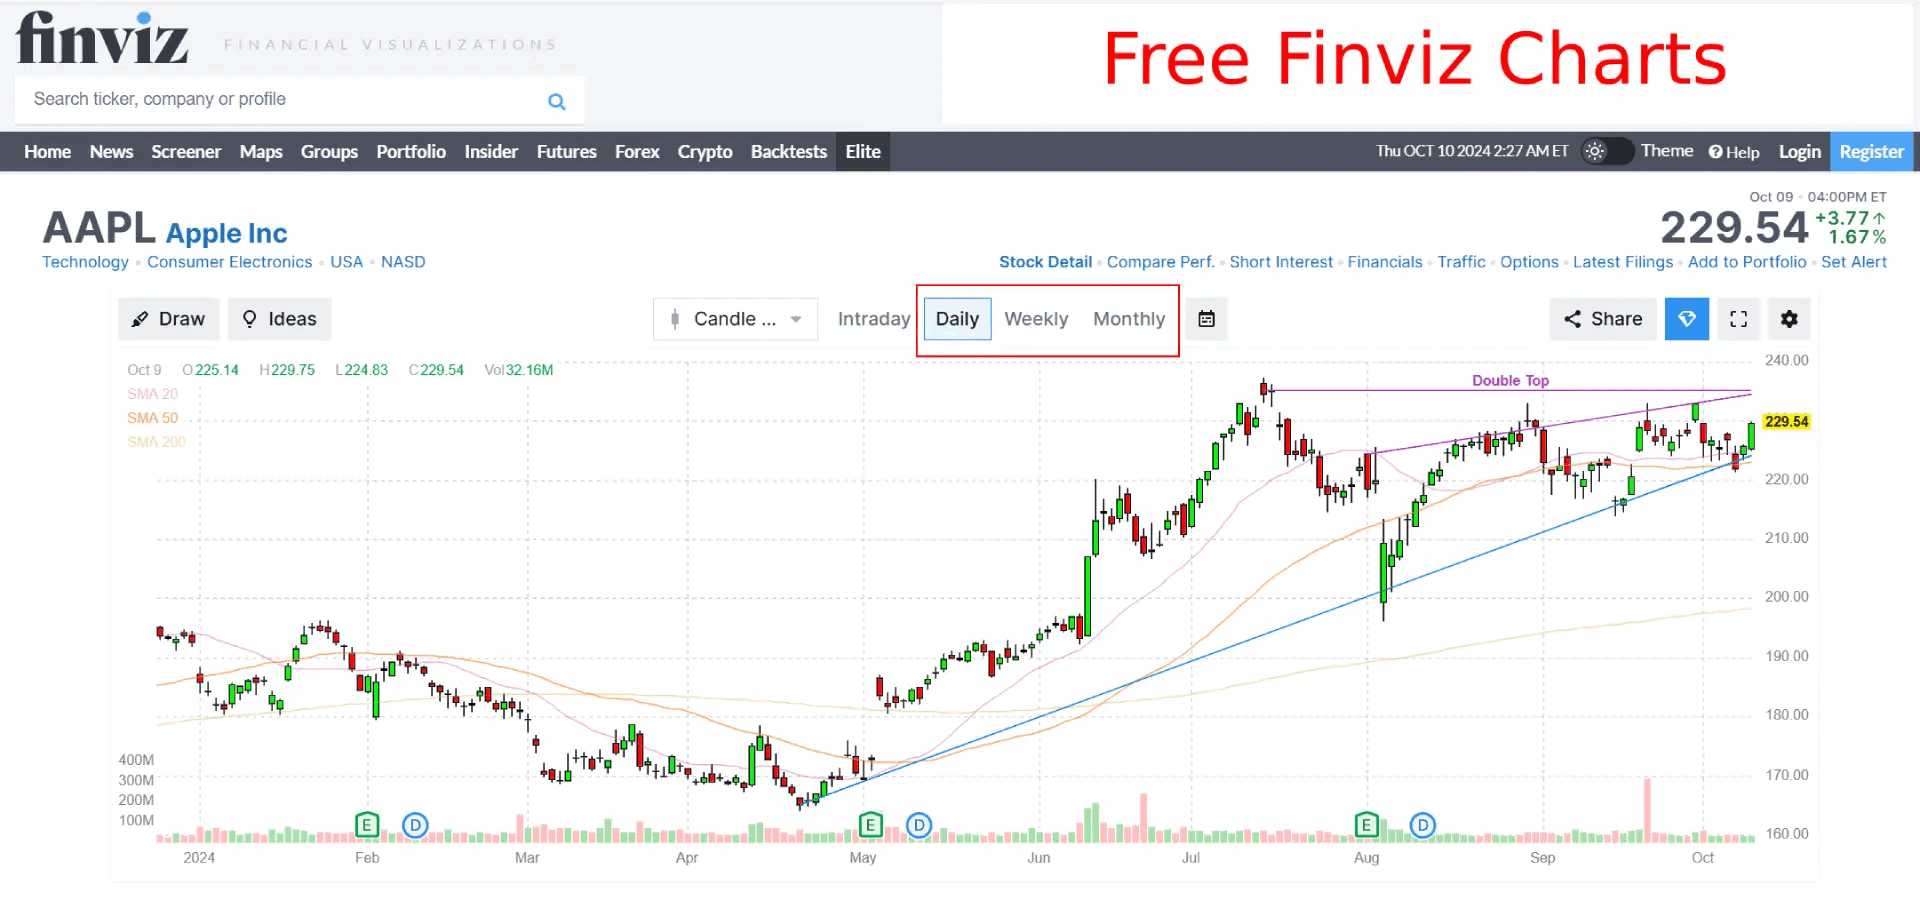
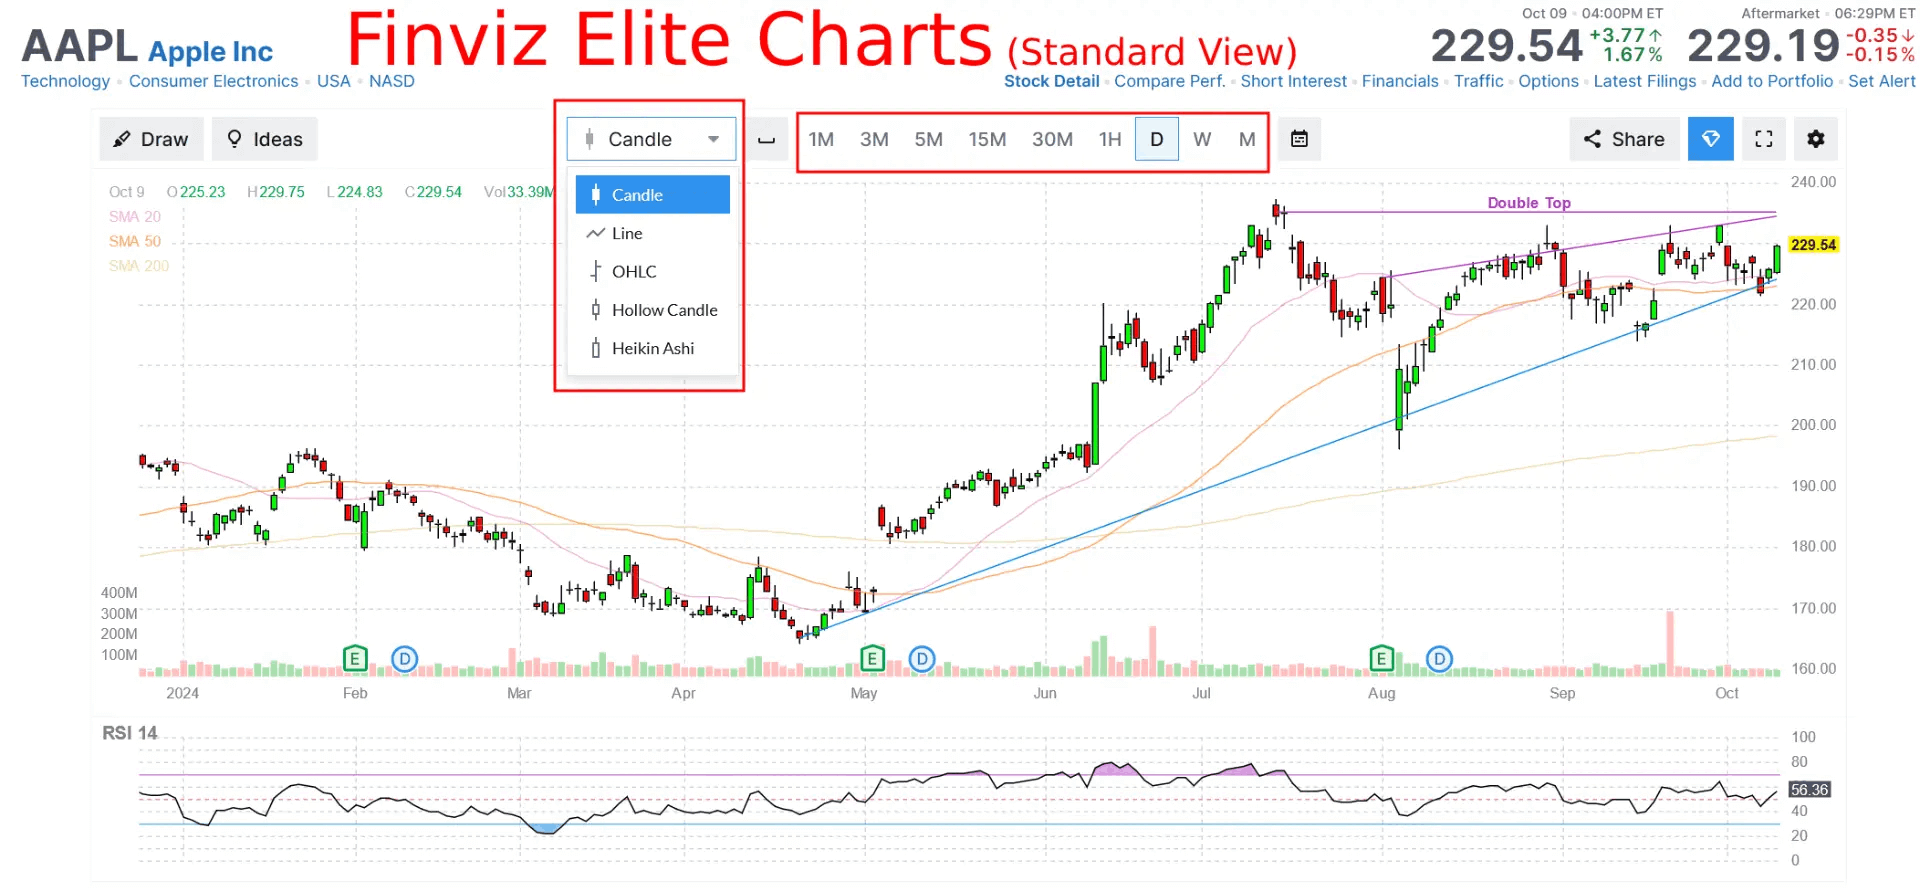
Finviz Elite takes the charting section to a whole new level because with Finviz Elite you have access to realtime courses, time intervals from 1 minute to 1 month, trading indicators, and chart types when using the standard charting.
If you go with the advanced charting of Finviz Elite, you can use many drawing tools in a full-screen mode. In addition, you can select layouts for your chart visualization and show up to 6 charts at the same time.
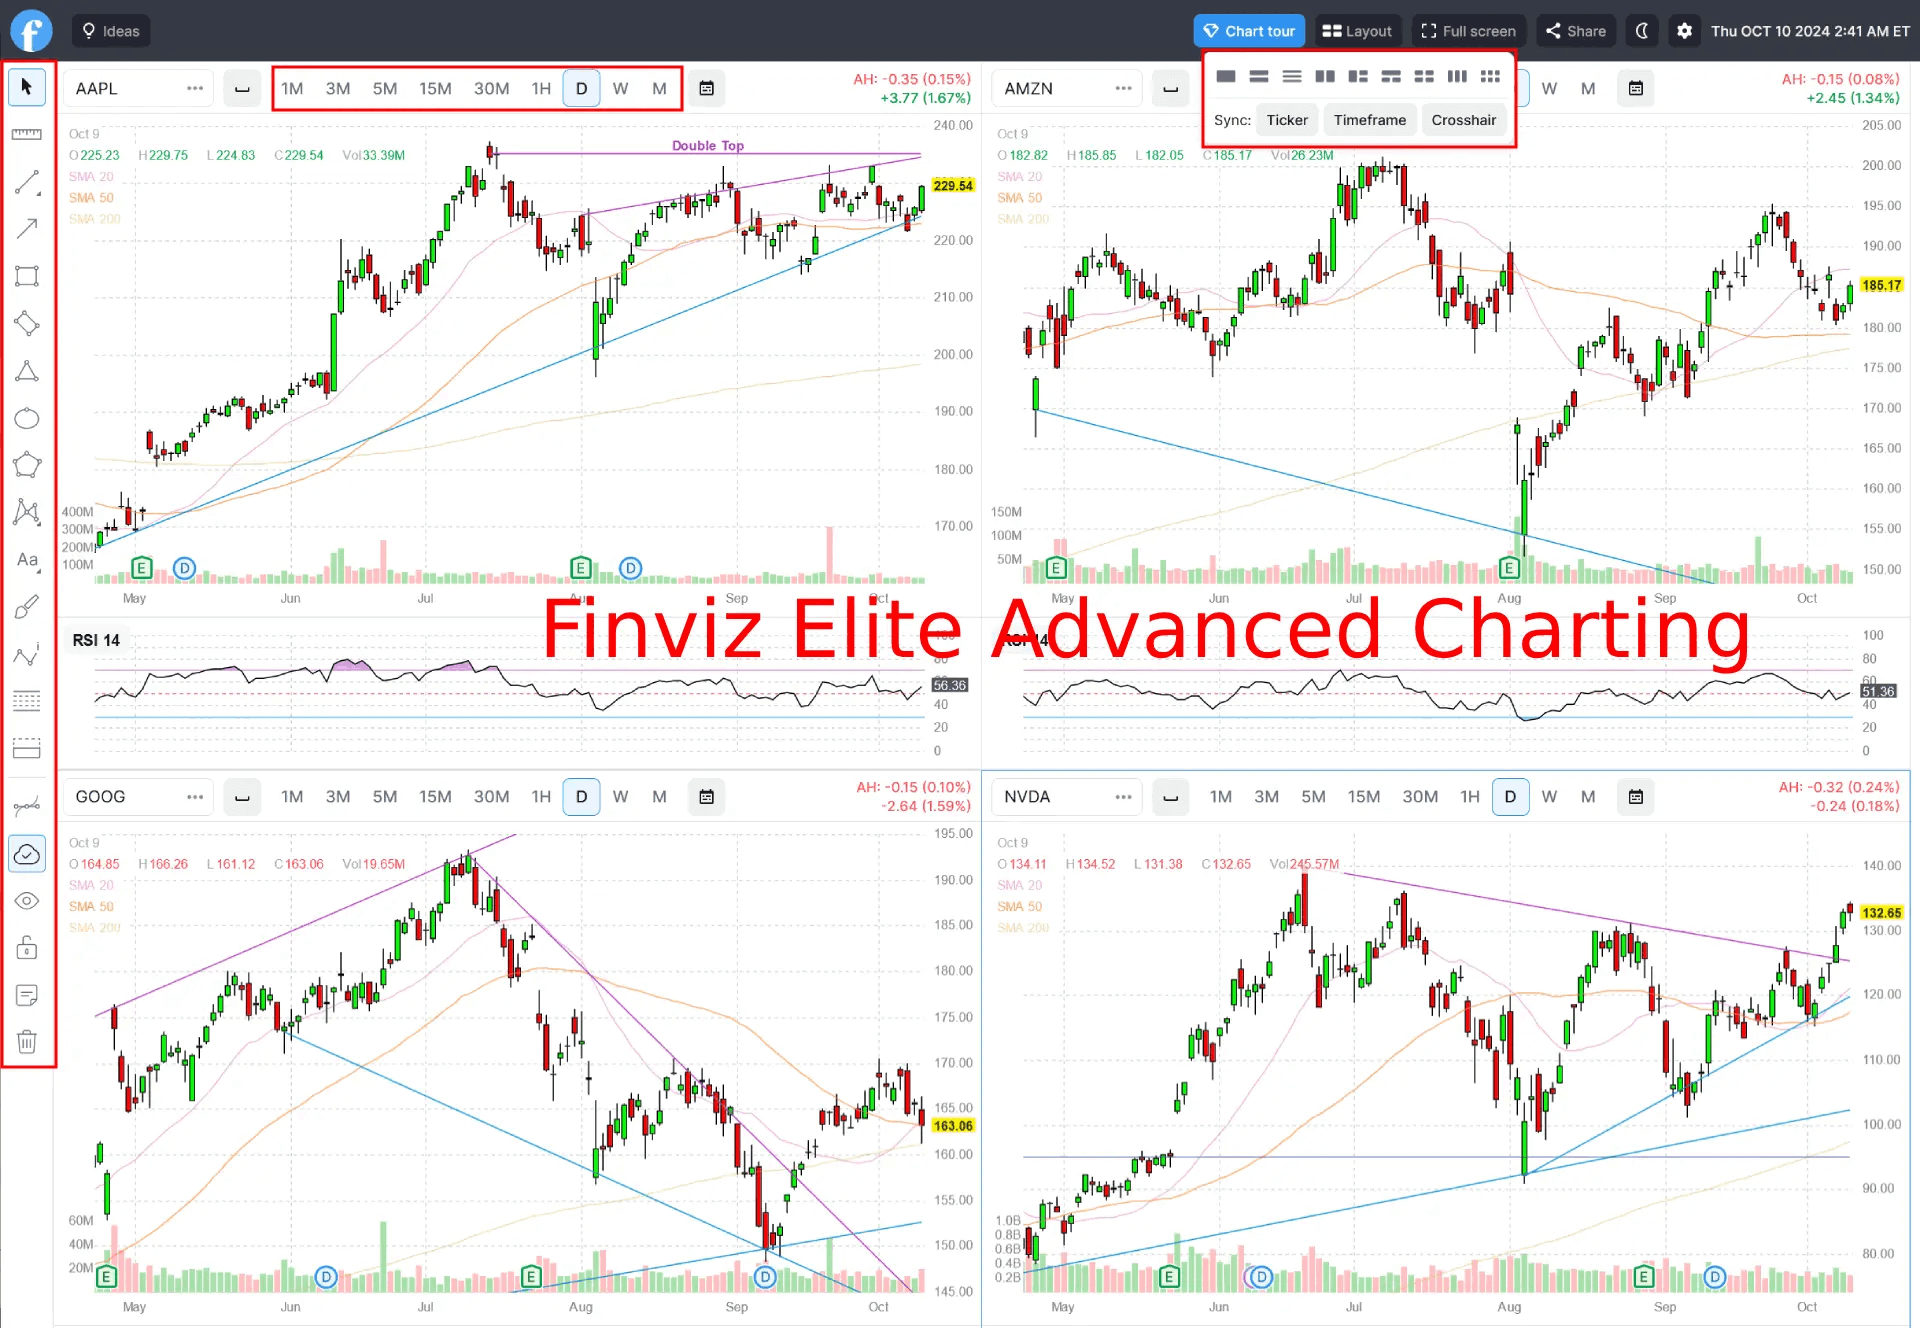
Across the charts, you can sync your crosshair, time frame or ticker if you like. Every layout including annotations and notes can be saved and you can open it from any device where you log in to your Finviz Elite account.
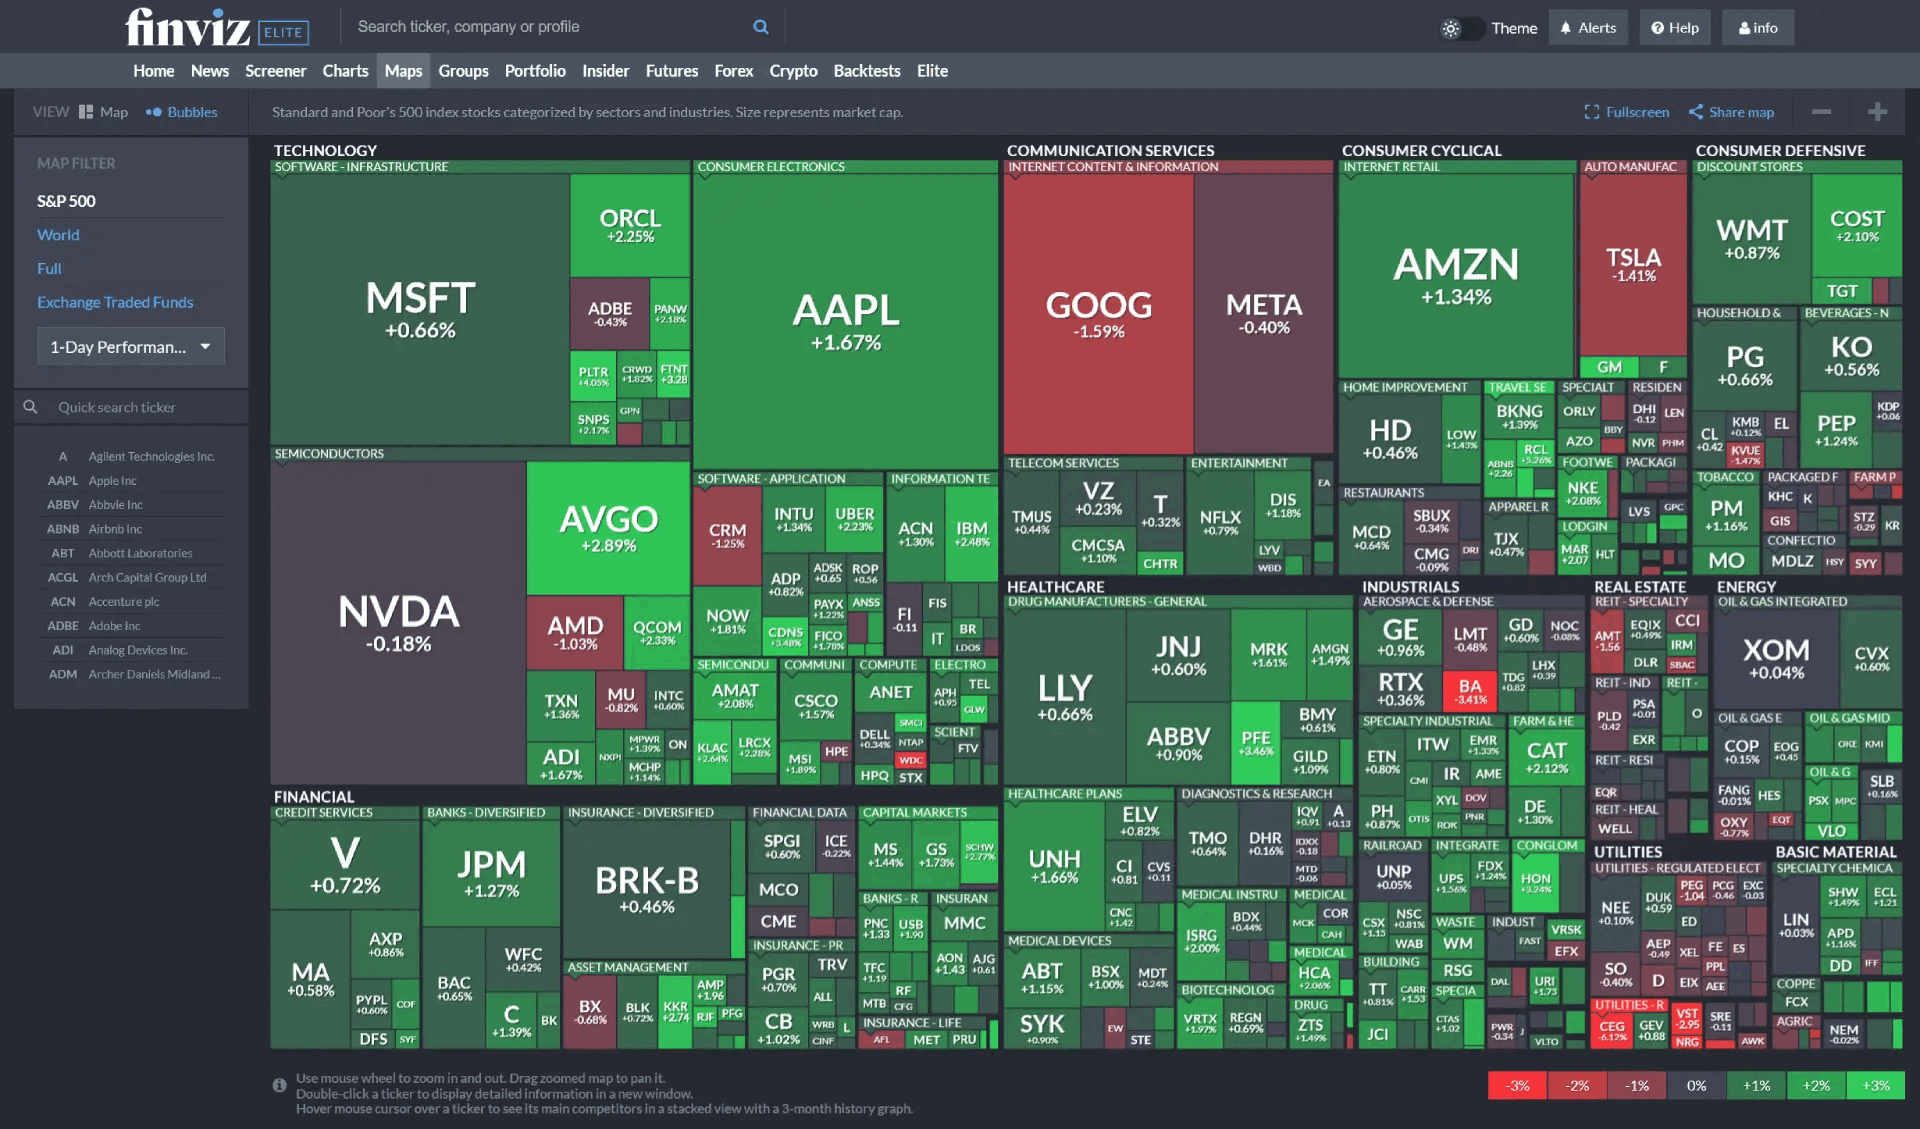
Maps
The maps feature is something you might know as heatmaps from other tools. What Finviz does here is visualizing the performance of stocks within specific industries and sectors. The more weight a stock has within a sector, the more room it has on the map and the higher the change vs. the selected period (e.g. current minute vs. minute before, current day vs. day before, current year vs. year before, etc.).
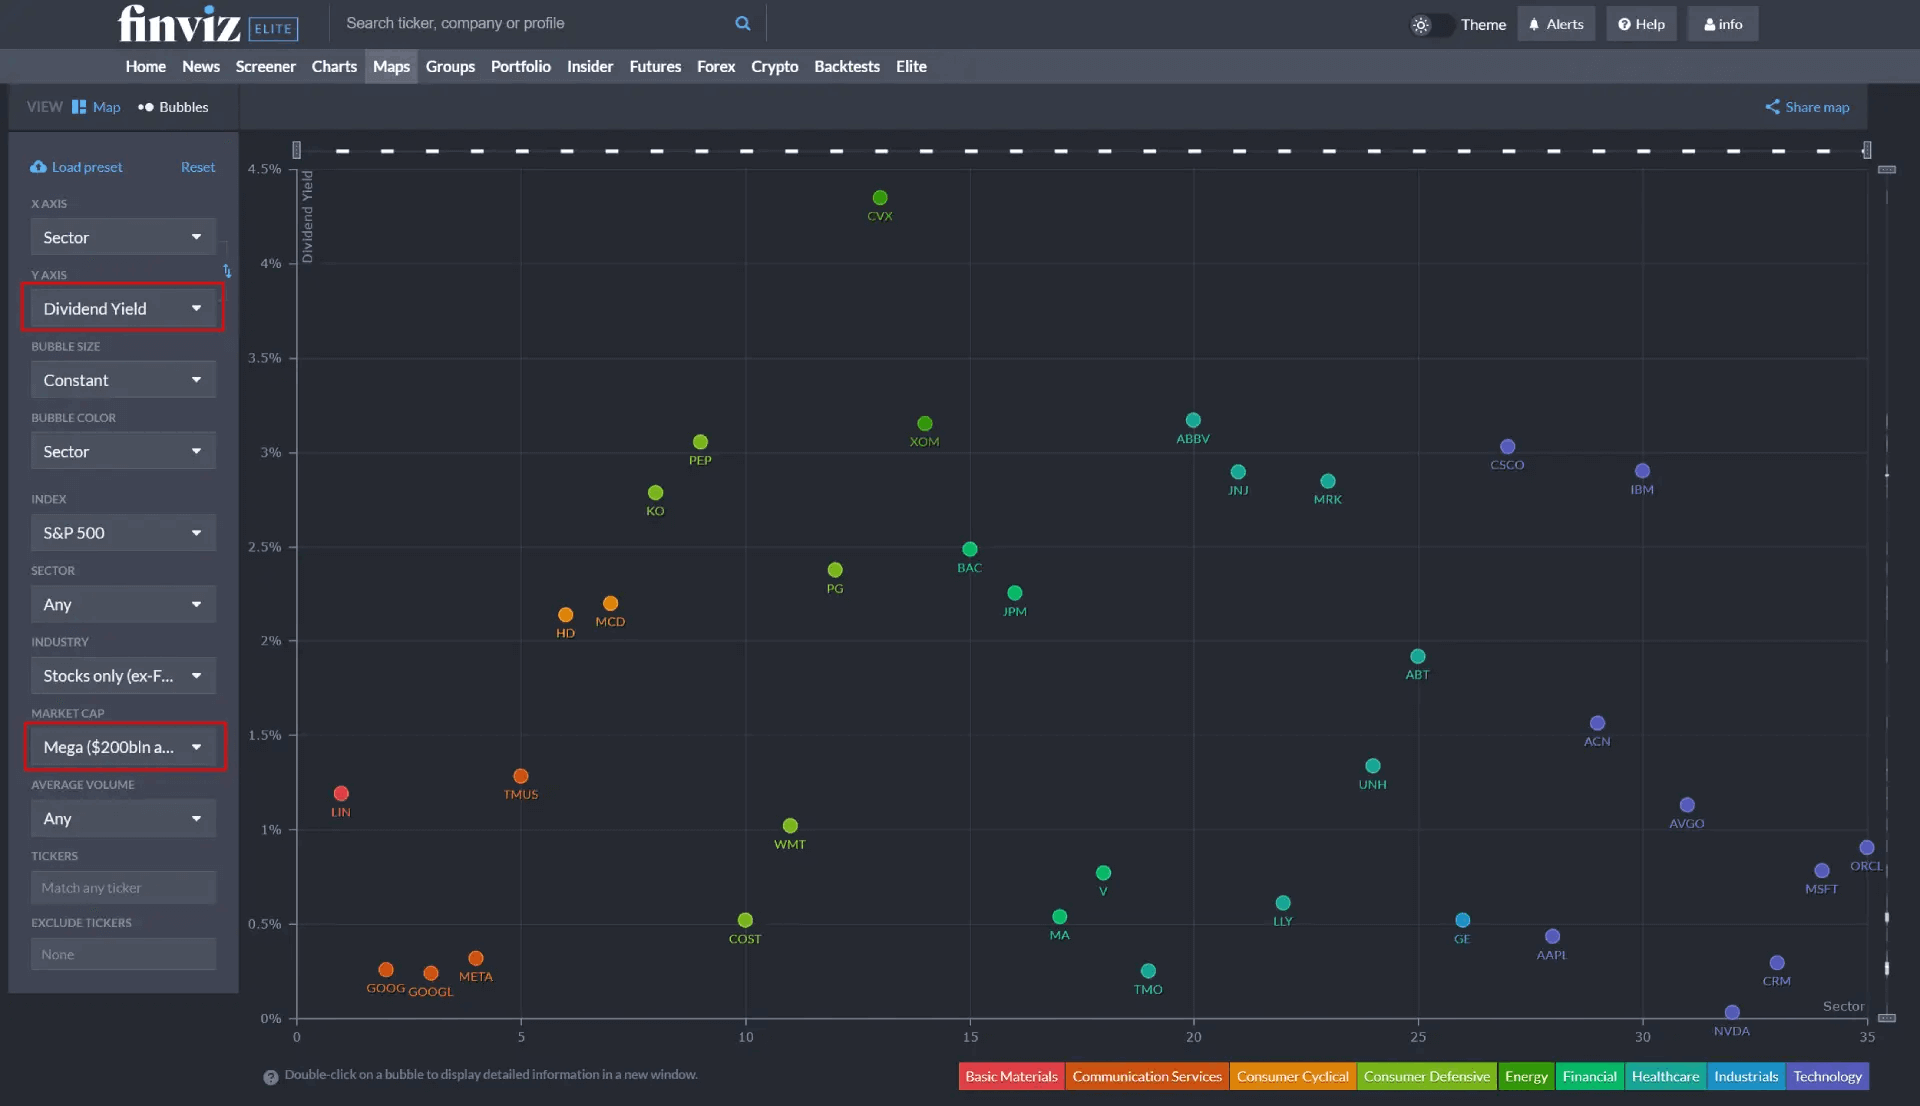
Something new is the way to visualize the maps as bubbles on a graph where you freely select an X axis and an Y axis and then you can visualize for example the change on one axis and the market capitalization to crate relative performance across various sectors.
Groups
The group’s feature is nothing fancy. Here you see the performance of sectors, industries or capitalization in 1 day, 1 week, 1 month, 3 months etc. There are various visualization types like bar charts, spectrum visualization and more.
Portfolio
The portfolio feature lets you basically create hypothetical portfolios or watchlists by adding your favorite tickers like AAPL, AMZN, MSFT, etc. If you create such portfolios, you can then select this portfolio when you use a screener, interactive maps, news, insider trading etc. Be aware this feature does not let you connect your real portfolio.
Insider
The latest insider trading, top insider trading in the recent week and top 10% owner trading in a recent week can be seen in the Insider tab. You can filter down for buy and sell transactions, but that’s it. If you do, you see all the details like the ticker, the owner who made insider trades, the relationship of the insider to the company, the date, transaction type, costs, shares, value and time stamp.
Futures
Futures indicate how the market will open at a day and provide insights before the stock market opens because futures markets have longer trading times. In the Futures tab, you can check various indicates, but also futures types like energy, bonds, softs, metals, meats, grains and currencies.
The quotes can be shown as average, 5-minute, hourly, daily, weekly or monthly performance.
Forex
The Forex tab is basically similar to the Futures tab, but instead of futures, you see the top 12 currencies with their performance and little price charts and performance metrics.
Crypto
Crypto is, like Futures and Forex, a quick overview across the main indices and assets, specifically within the crypto market. (BTC/USD, ETH/USD, etc.)
Backtests
The backtest feature is a pretty cool one. Here you can create backtest scenarios and use an immense historical data pool to accomplish your goal of testing strategies. Let’s say you want to test the S&P 500 with all of its tickers from 1996 until today. You can do so with Finviz Elite.
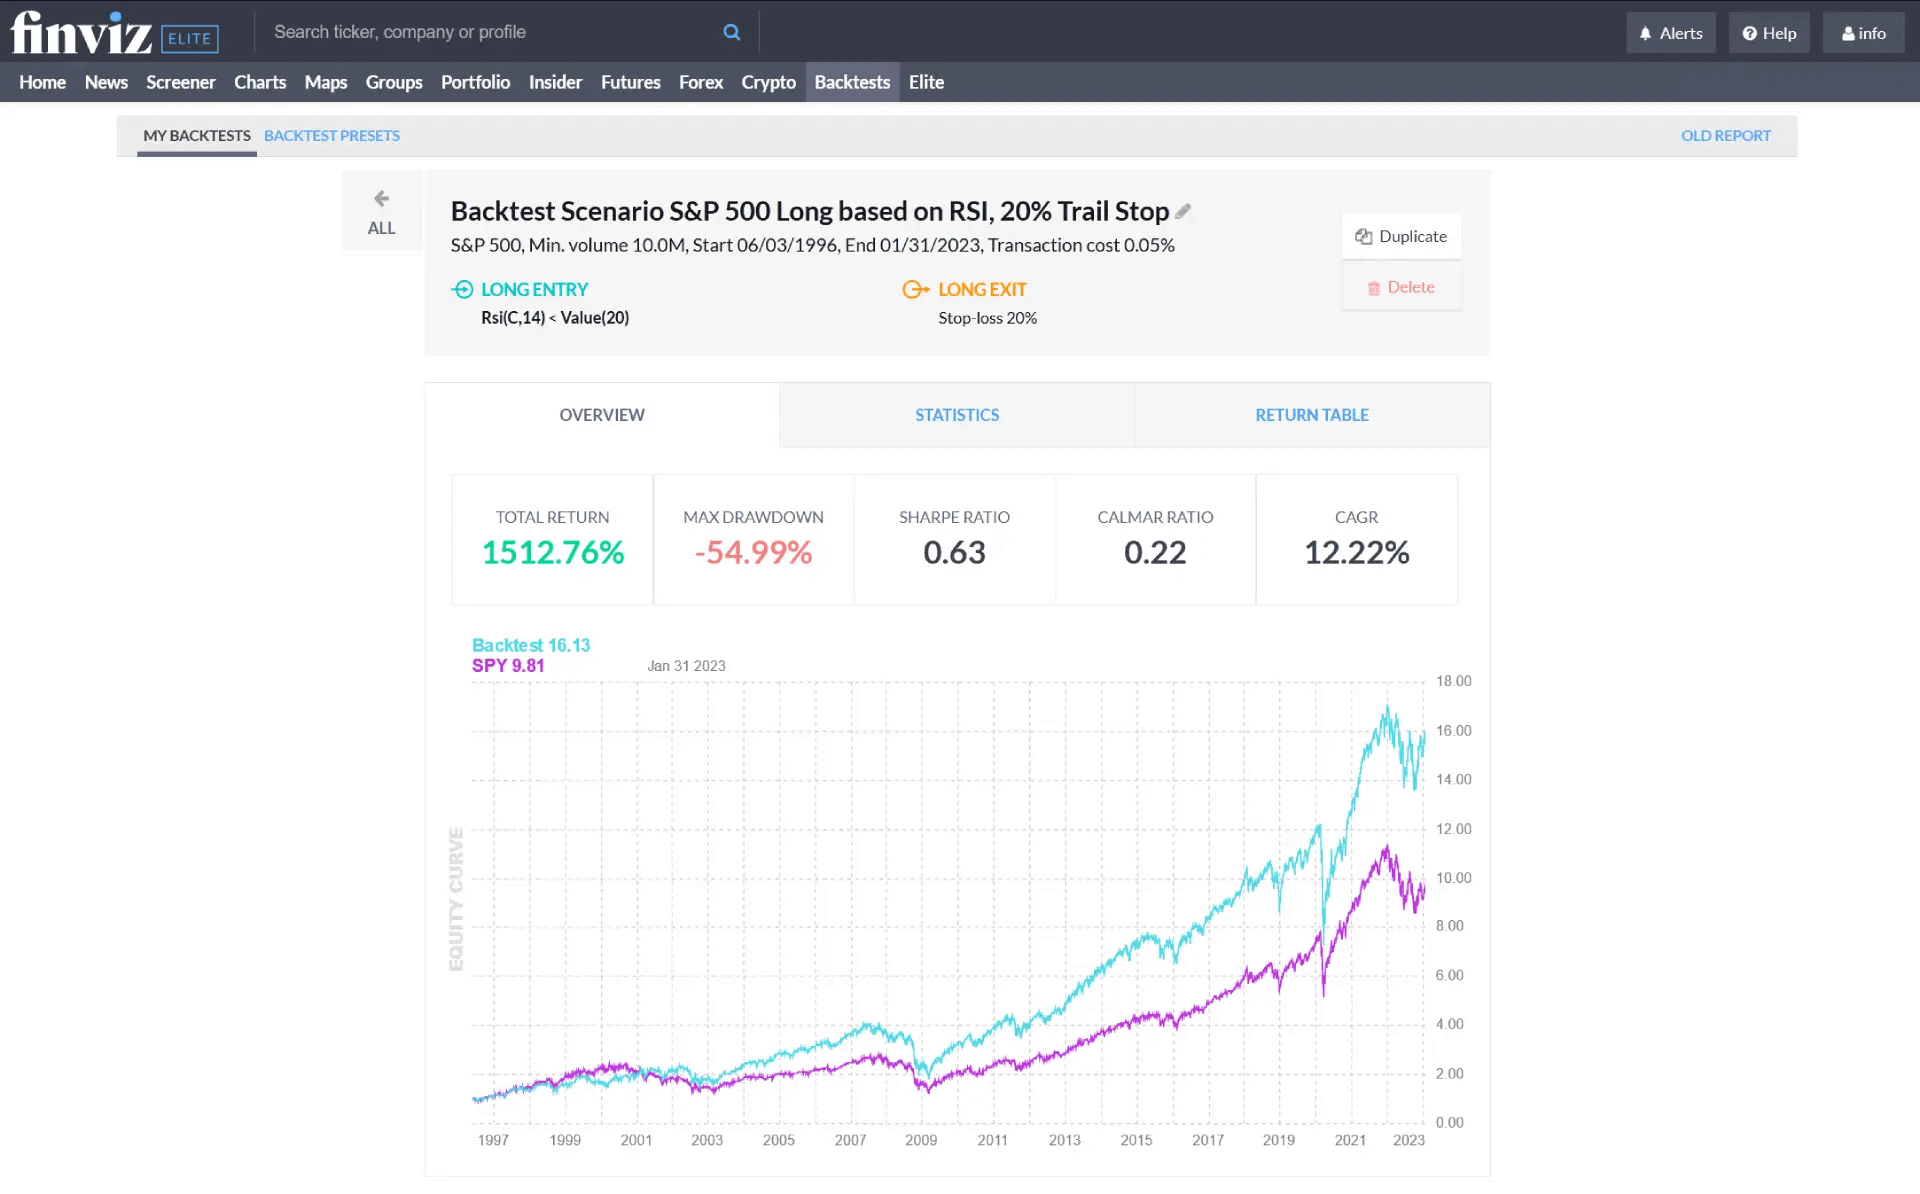
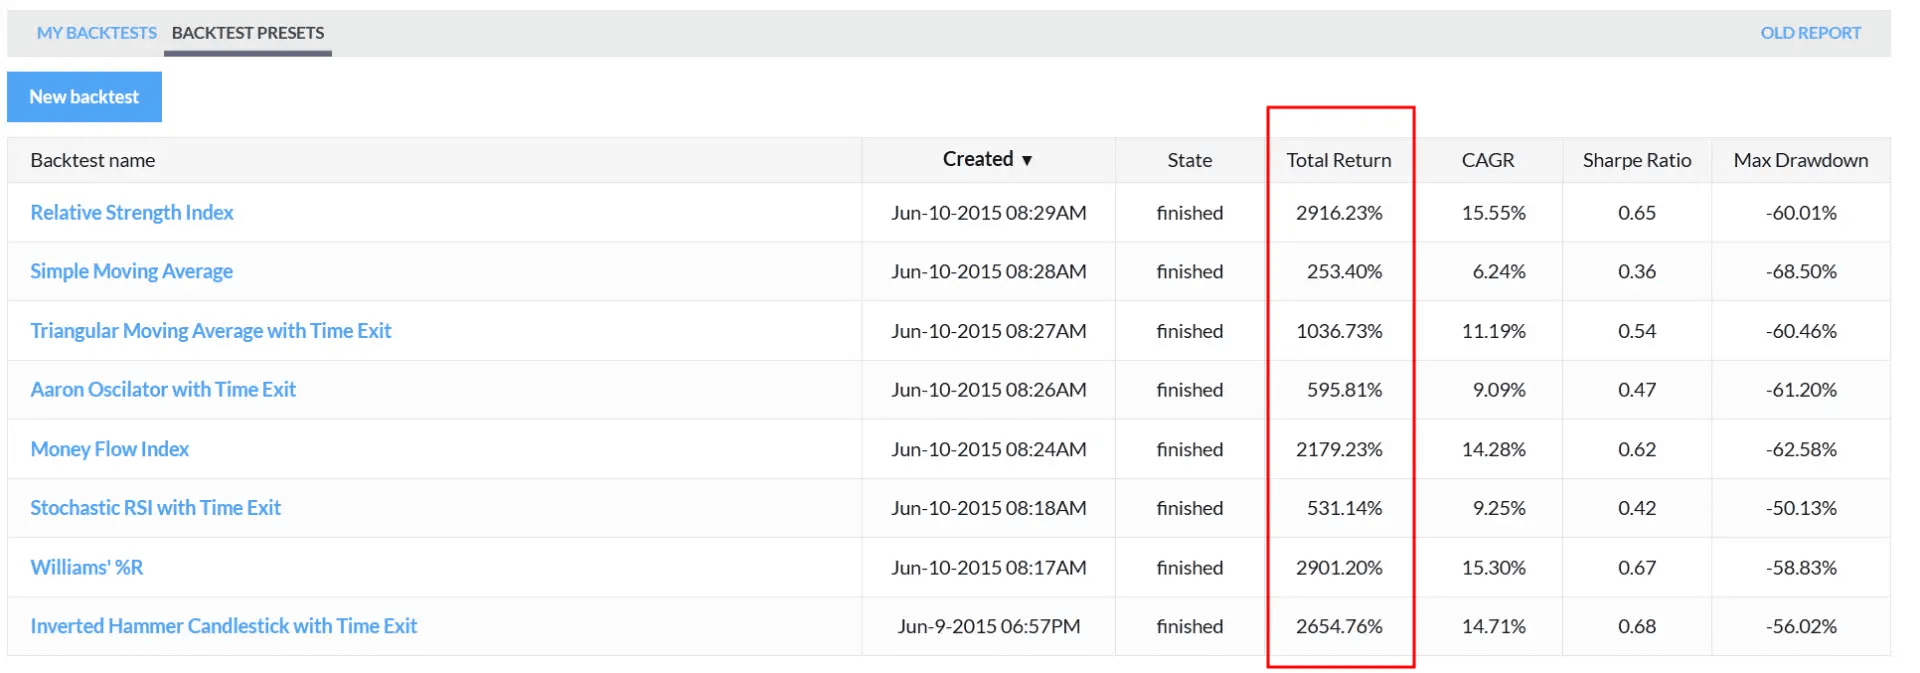
All you have to do is decide if you want to simulate a long or short strategy, define the parameters (e.g., EMA20 crosses EMA 200 to go long), decide which signal indicates the exit of the trade and then run the backtest. You find various pre-defined backtests as orientation under Backtest Presets, where some of them have a return of over 2,000% with a CAGR of over 15%.
Finviz Pricing
The pricing could not be simpler. Either you pay $39.99 monthly by month, or $249 in advance, which equals $20,75 monthly.
- The smallest time frame is one minute (no tick-based intervals, no range bars)
- No international market data
Which Finviz Plan Is Right for Me?
Personally, I like the idea of testing Finviz inside out at first on the free version. The free version only has limited charting capabilities and delayed quotes, but you’ll quickly see if Finviz is your favorite stock screener and charting software, or not.
And if it is, I’d keep the risk as low as possible and first subscribe to the monthly plan. After this first month, you’ll know if it was the right choice. And then, if you are ready, go with the annual subscription because it reduces the costs by nearly 50%, so basically, pay only for 6 months and get Finviz Elite for 12 months.
Finviz Discounts
You save 48.11% on the annual plan compared to the monthly plan if you compare the total expenses over the period of 12 months.
Try Finviz Elite 7 days for free, register for a free account, or save 36% with annual plans.
Benefits of Paid Finviz Elite Plans
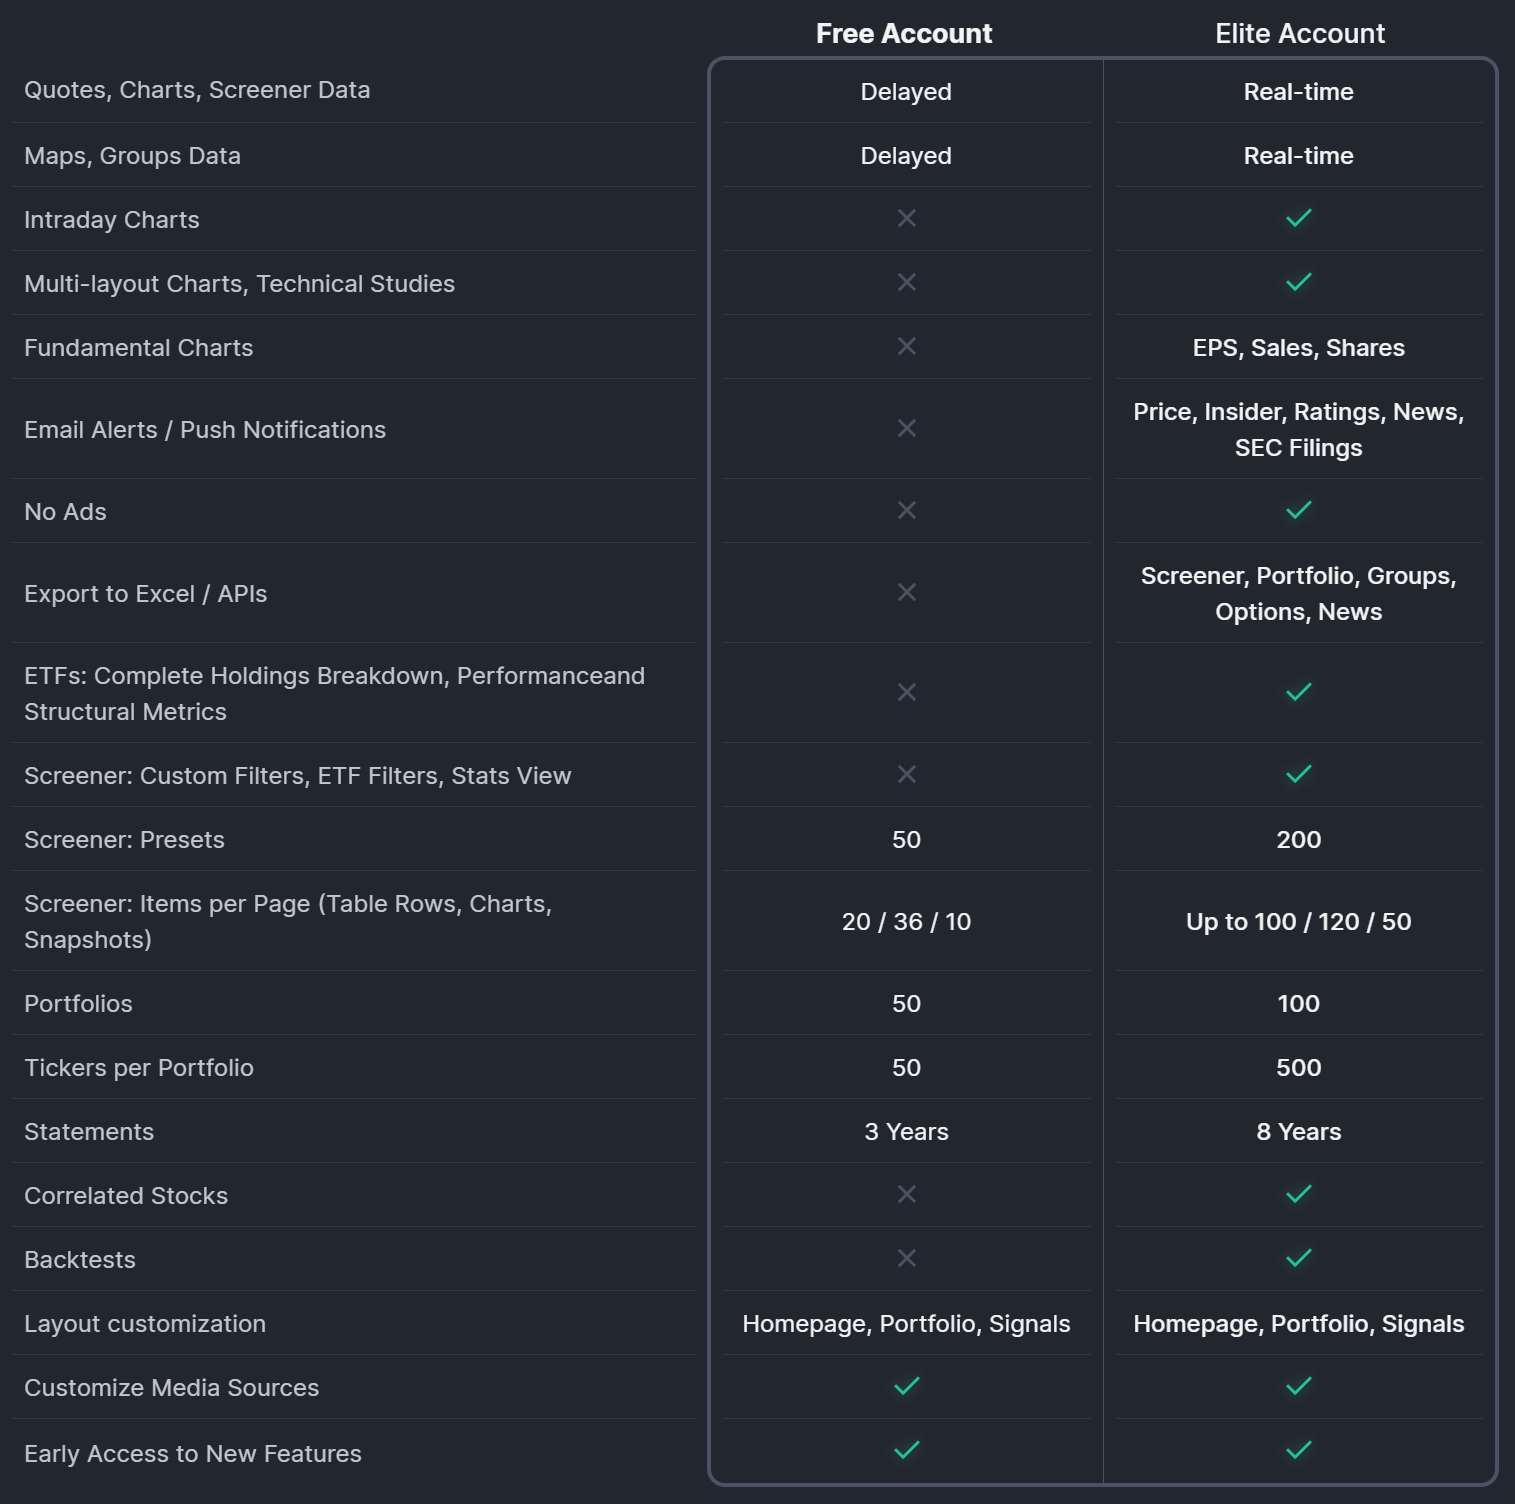
Finviz Elite is only worth the costs if you need the features that differentiate the Elite from the free version. The most important benefit is surely the fact that you have access to real-time quotes, charts and screening when you decide on Finviz Elite.
You also get access to advanced charts with technical studies, fundamental charts, custom stats views and ranges, and you can export the data to Excel and via APIs.
In addition, the paid plan unlocks the correlations analysis, you get an 8-year history of statements instead of 3 years in the free plan, and you have a higher number of portfolios, tickers, screener rows and access to email alerts.
Summary
I think Finviz is an excellent web-based charting software with excellent analysis capabilities. Finviz is a great choice for investors who want to check company fundamentals, news, and charts from one place at reasonable costs.
I often use bookmarks on my mobile phone to quickly select and check quotes for stocks that have my interest right now. One click on the bookmark, and I see everything, from quotes, and charts, to news and fundamentals.
Starting with the Finviz versions is a great idea, and when it comes to the paid plans, the annual subscription comes with the lowest average costs per month.
Try Finviz Elite 7 days for free, register for a free account, or save 36% with annual plans.
How Finviz Compares
You’ll quickly notice, that I use 5 different paid stock screeners and have access to all of them. They all have their benefits, but depending on what you really need, you might want to decide on one, or a maximum two paid screeners to keep costs low.
TradingView is a good alternative to Finviz. The tool has lots of data available to crunch, download and analyze. Overall, I think TradingView does better than Finviz when it comes to chart analysis, and it also has international market data available.
Day traders consider Trade Ideas over Finviz, and if technical analysis is most important, check out TrendSpider, and as an investor, consider Stock Rover.
Pros
- 72 filters on the stock screener
- 98 filters for exchange-traded funds
- High-speed financial visualizations
- Intraday real-time data with Finviz Elite
- No extra costs for exchange data
- Great user experience
Cons
- Not perfectl if you want to day trade
Read Customer Reviews of finviz.com
Finviz currently has a Trustpilot rating of 4.0 out of 5, based on 20 reviews, which is categorized as great. The distribution of the overall ratings, ranging from 1 to 5, looks natural. Relative to its overall popularity, Finviz could more actively manage Trustpilot engagement among their users, to better reflect the user’s opinion in more detail.
Our opinion: The free Finviz account will quickly indicate whether it is worth it to use Finviz, independently of the Trustpilot ratings.