Most futures traders have their execution platform dialed in. NinjaTrader, Tradovate, Rithmic. They’ve got order routing covered. What’s less common is having a fast, reliable way to read the broader market picture before placing a single order. Which sectors are rotating? What’s ES doing relative to NQ? Where’s the real money moving in pre-market? That’s where Finviz fits in: not as a replacement for your trading platform, but as the reconnaissance layer that precedes it.
Prop Firm App is reader-supported. If you click on a link, our partners may compensate us.
About Finviz
So let’s be clear about what Finviz is: a web-based stock screener and financial visualization platform. It covers U.S. equities across NYSE, Nasdaq, and Amex (more than 8,000 stocks and ETFs), plus market overview panels for futures, forex, and crypto. Founded in 2007, it now draws around 25 million monthly users, which tells you something about the value-to-cost ratio. It’s not a trading terminal. You’re not routing orders through it. But as a daily market context tool that tells you where the action is and why, it’s genuinely hard to beat at the price point.
Try Finviz Elite 7 days for free, register for a free account, or save 36% with annual plans.
The Screener: Why 25 Million People Show Up
The stock and ETF screener is the reason Finviz exists, and it’s the thing that earns its reputation. More than 60 filters on the stock side: price, float, volume, short interest, gap, RSI, moving average relationships, candlestick patterns, and a lot more. ETF screening runs even deeper at 98 filter types. The whole thing works without a login, without a subscription, and without a loading spinner that makes you question your life choices.
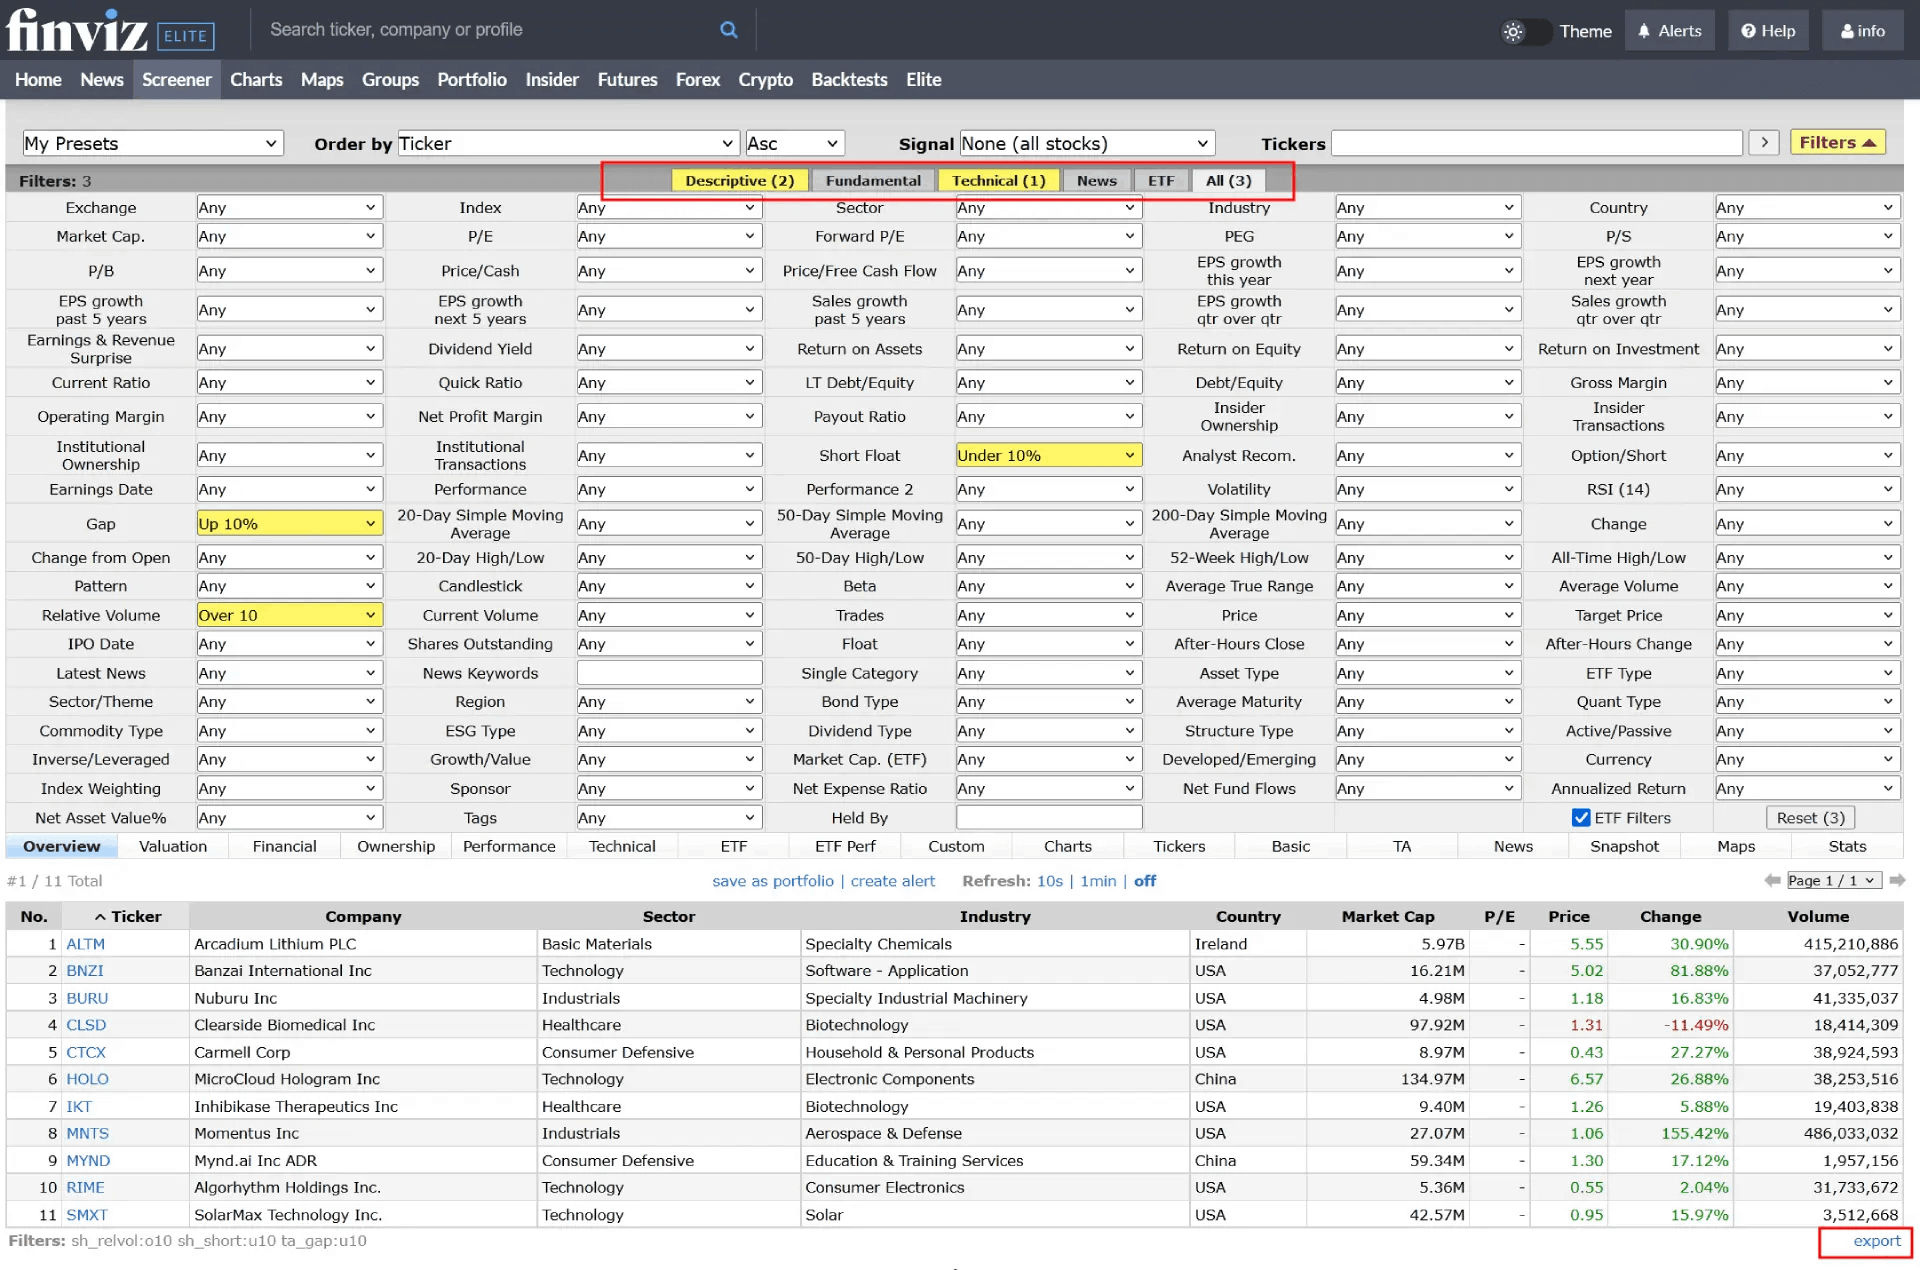
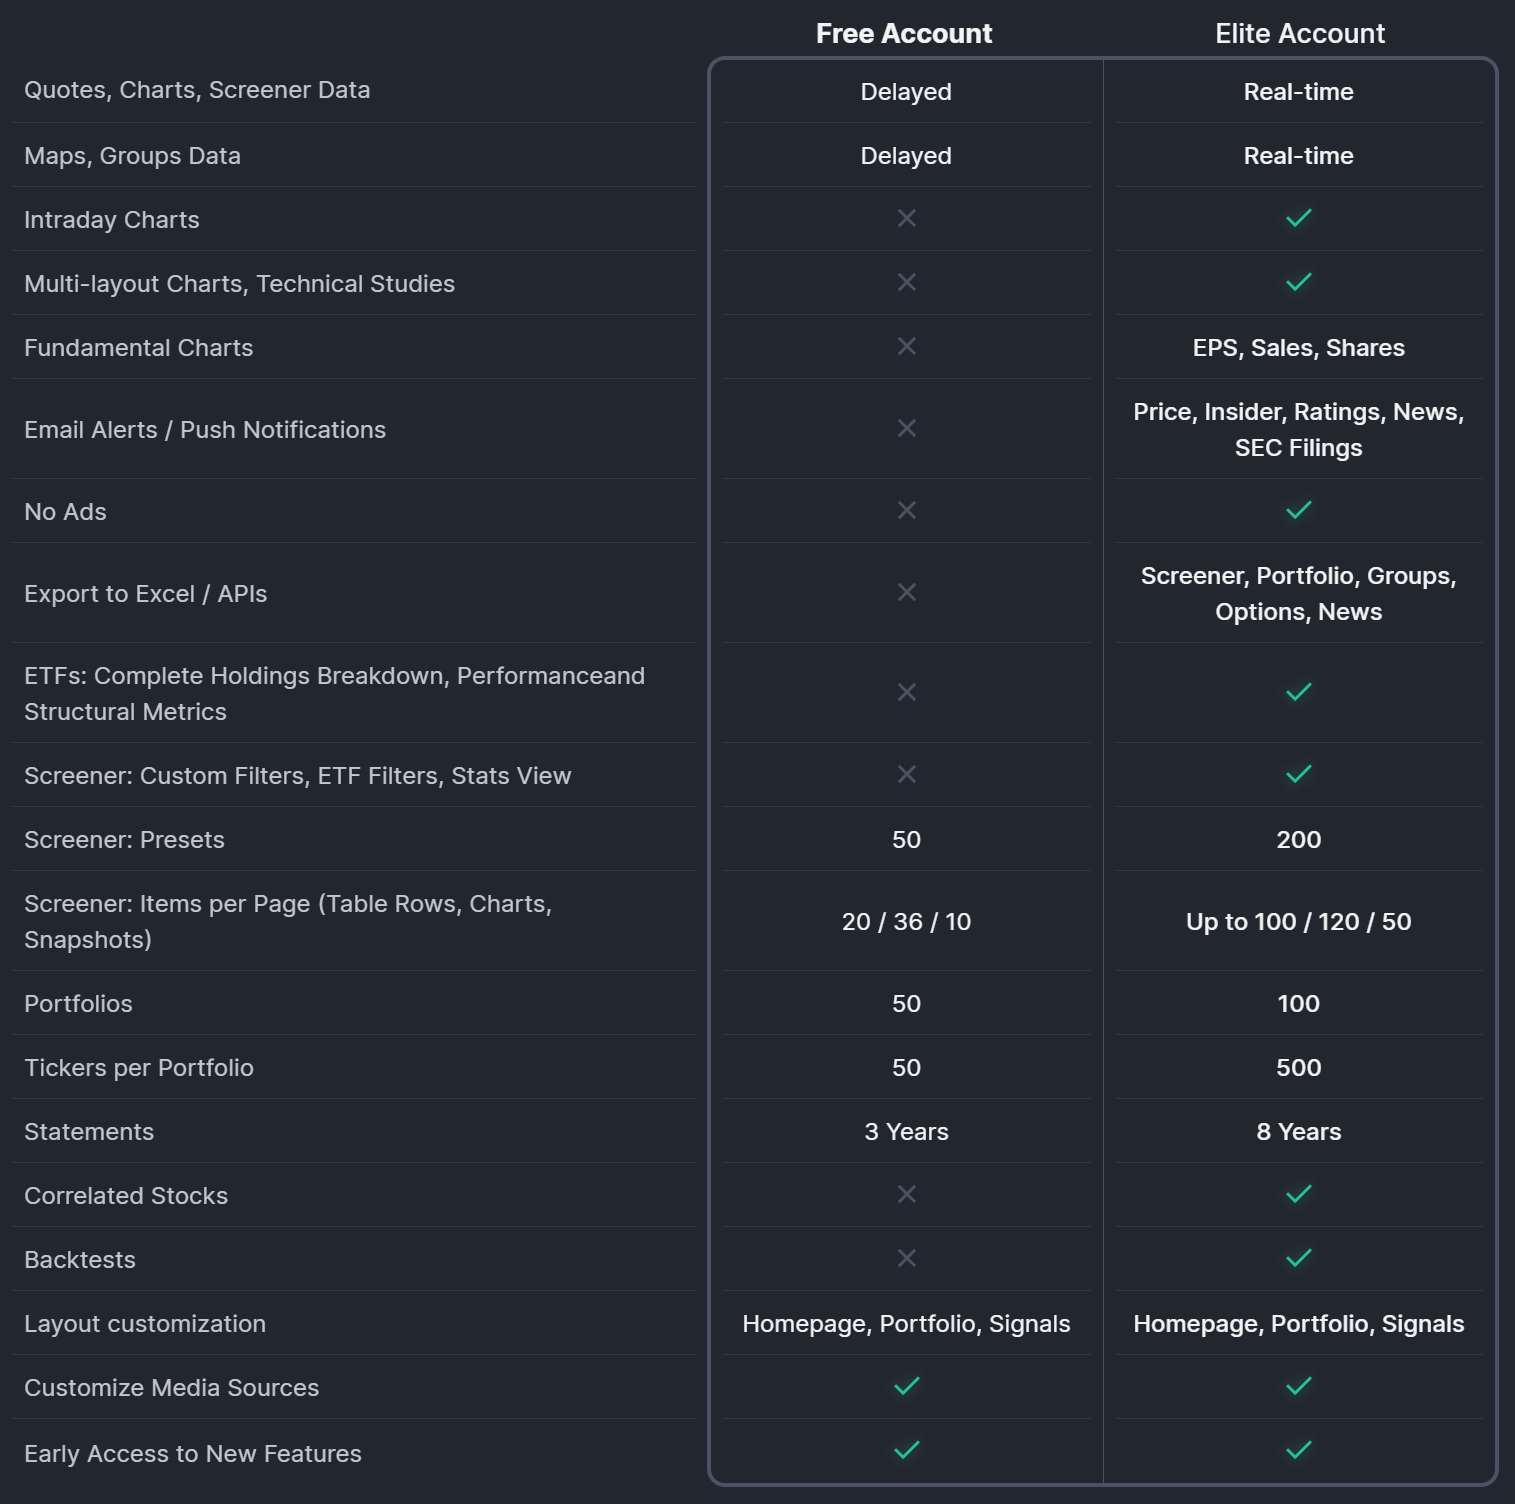
Free users get delayed data on screener results, which matters for intraday scalpers and is basically irrelevant for swing traders and investors working off end-of-day setups. That distinction is worth sitting with before deciding whether Elite is necessary for your use case. If you’re building a watchlist of momentum names for tomorrow’s open, the free screener does that. If you need to see which names are gapping pre-market right now, that’s Elite territory.
The Elite screener adds real-time data across all results, deeper customizable filter combinations, up to 200 saved presets (versus 50 on the free tier), and the data export. That export is the most underrated feature in the entire platform. Select every available data field, apply no filters, click export, and you have a CSV covering the entire U.S. equity universe, roughly 8,000 stocks with 71 columns of data, in one click. For traders building systematic strategies, testing signals in Excel, or just wanting a daily snapshot of the full market they can actually work with, that capability at under $25 a month annually is pretty hard to argue with.
Charts and Heatmaps
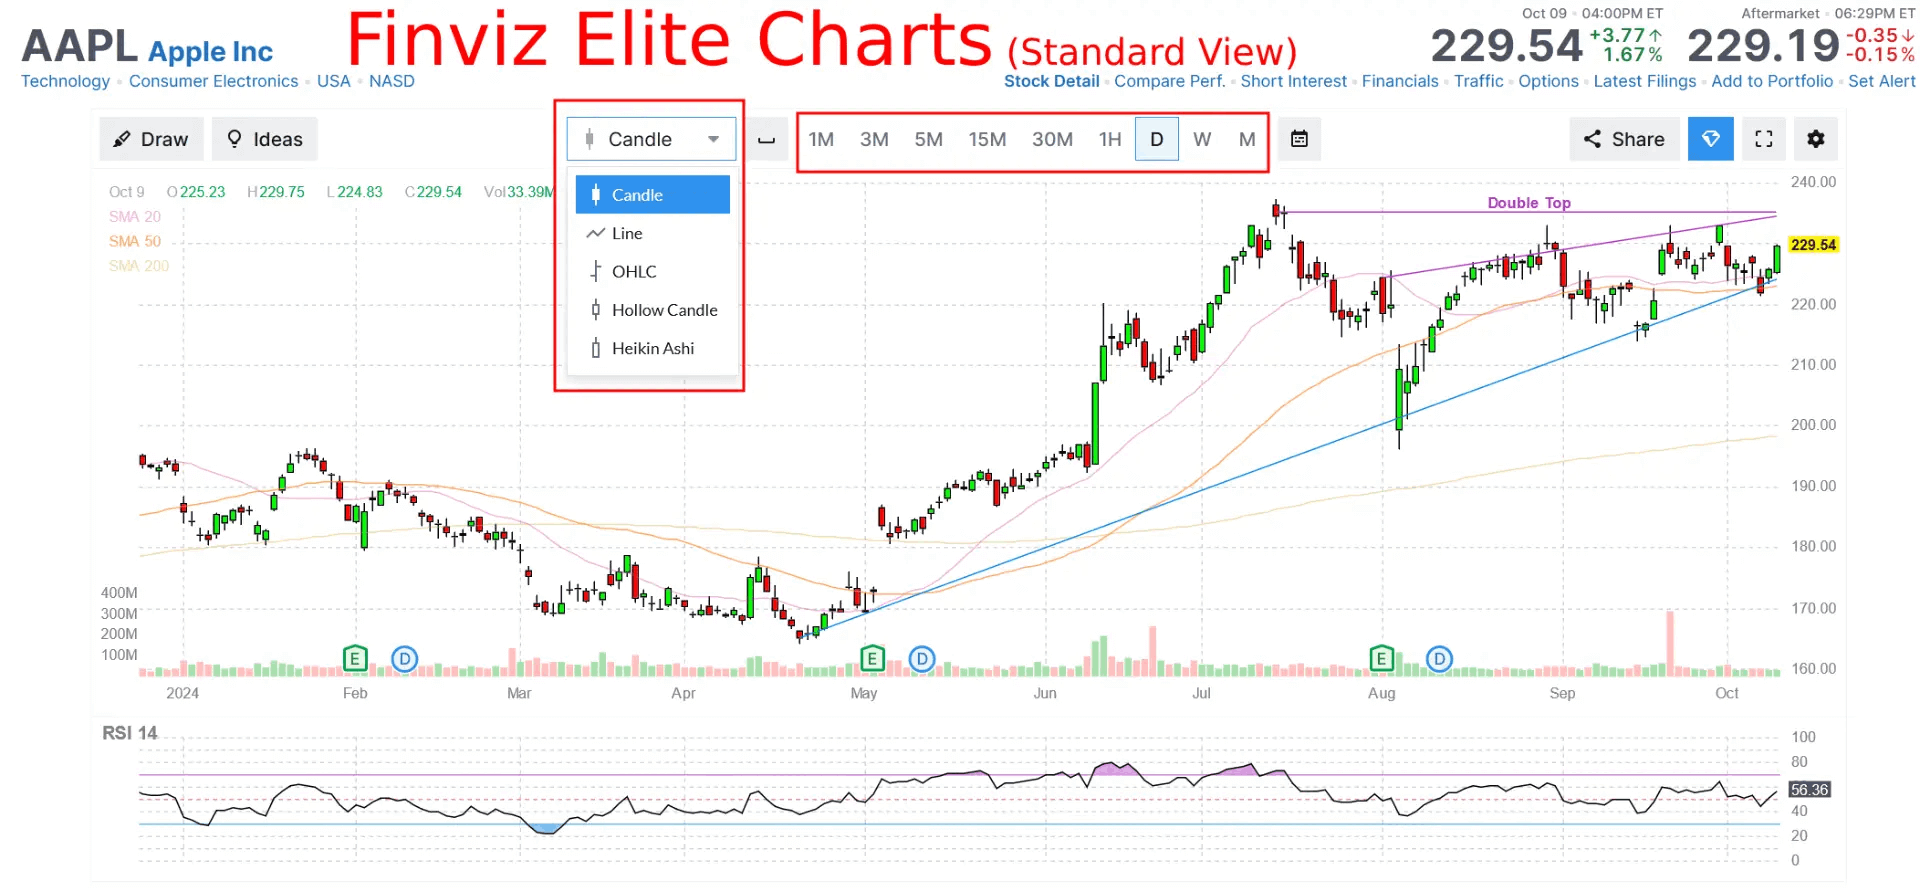
The charting on the free version is minimal by design: daily, weekly, and monthly timeframes, candle and line chart types, no drawing tools, delayed data. It’s enough to see a chart. It’s not enough to do any serious technical work.
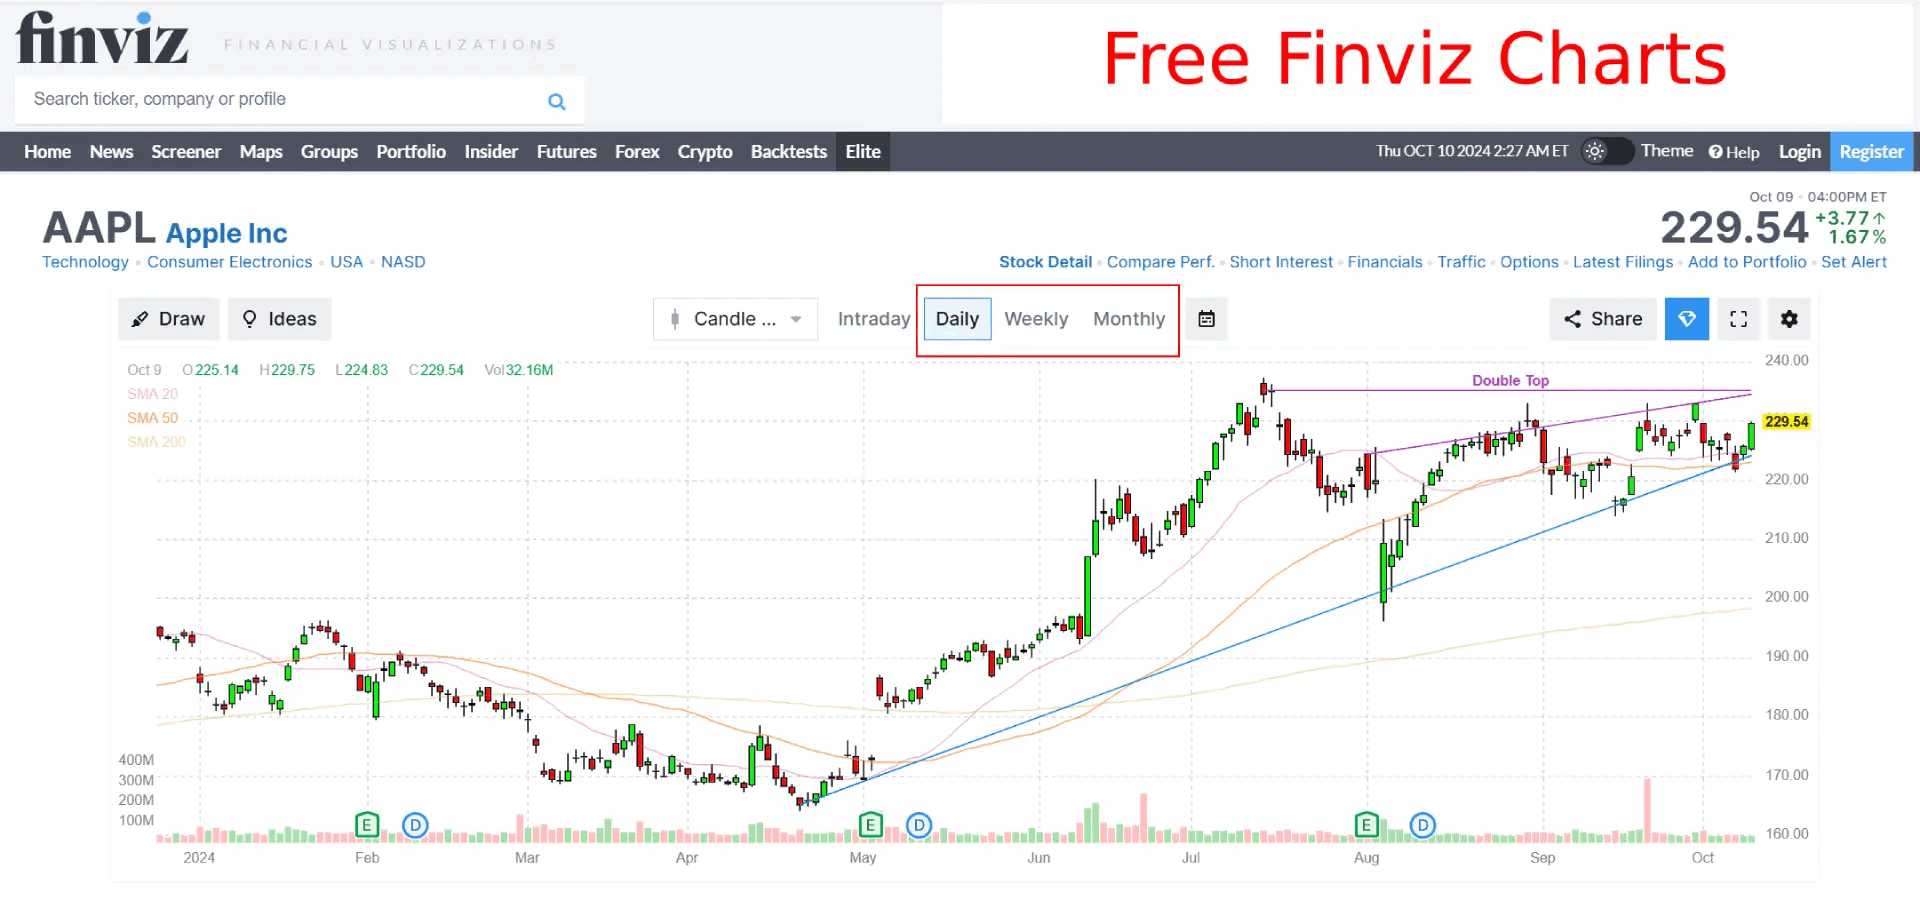
Elite changes the picture. Intraday timeframes start at 1 minute and run through to monthly. Drawing tools include trend lines and Fibonacci retracements. Technical studies are configurable and save automatically across sessions. You can run up to 6 charts simultaneously in a multi-layout view, sync crosshairs and timeframes across them, and pull up chart previews for watchlisted tickers without navigating away from whatever you’re doing.
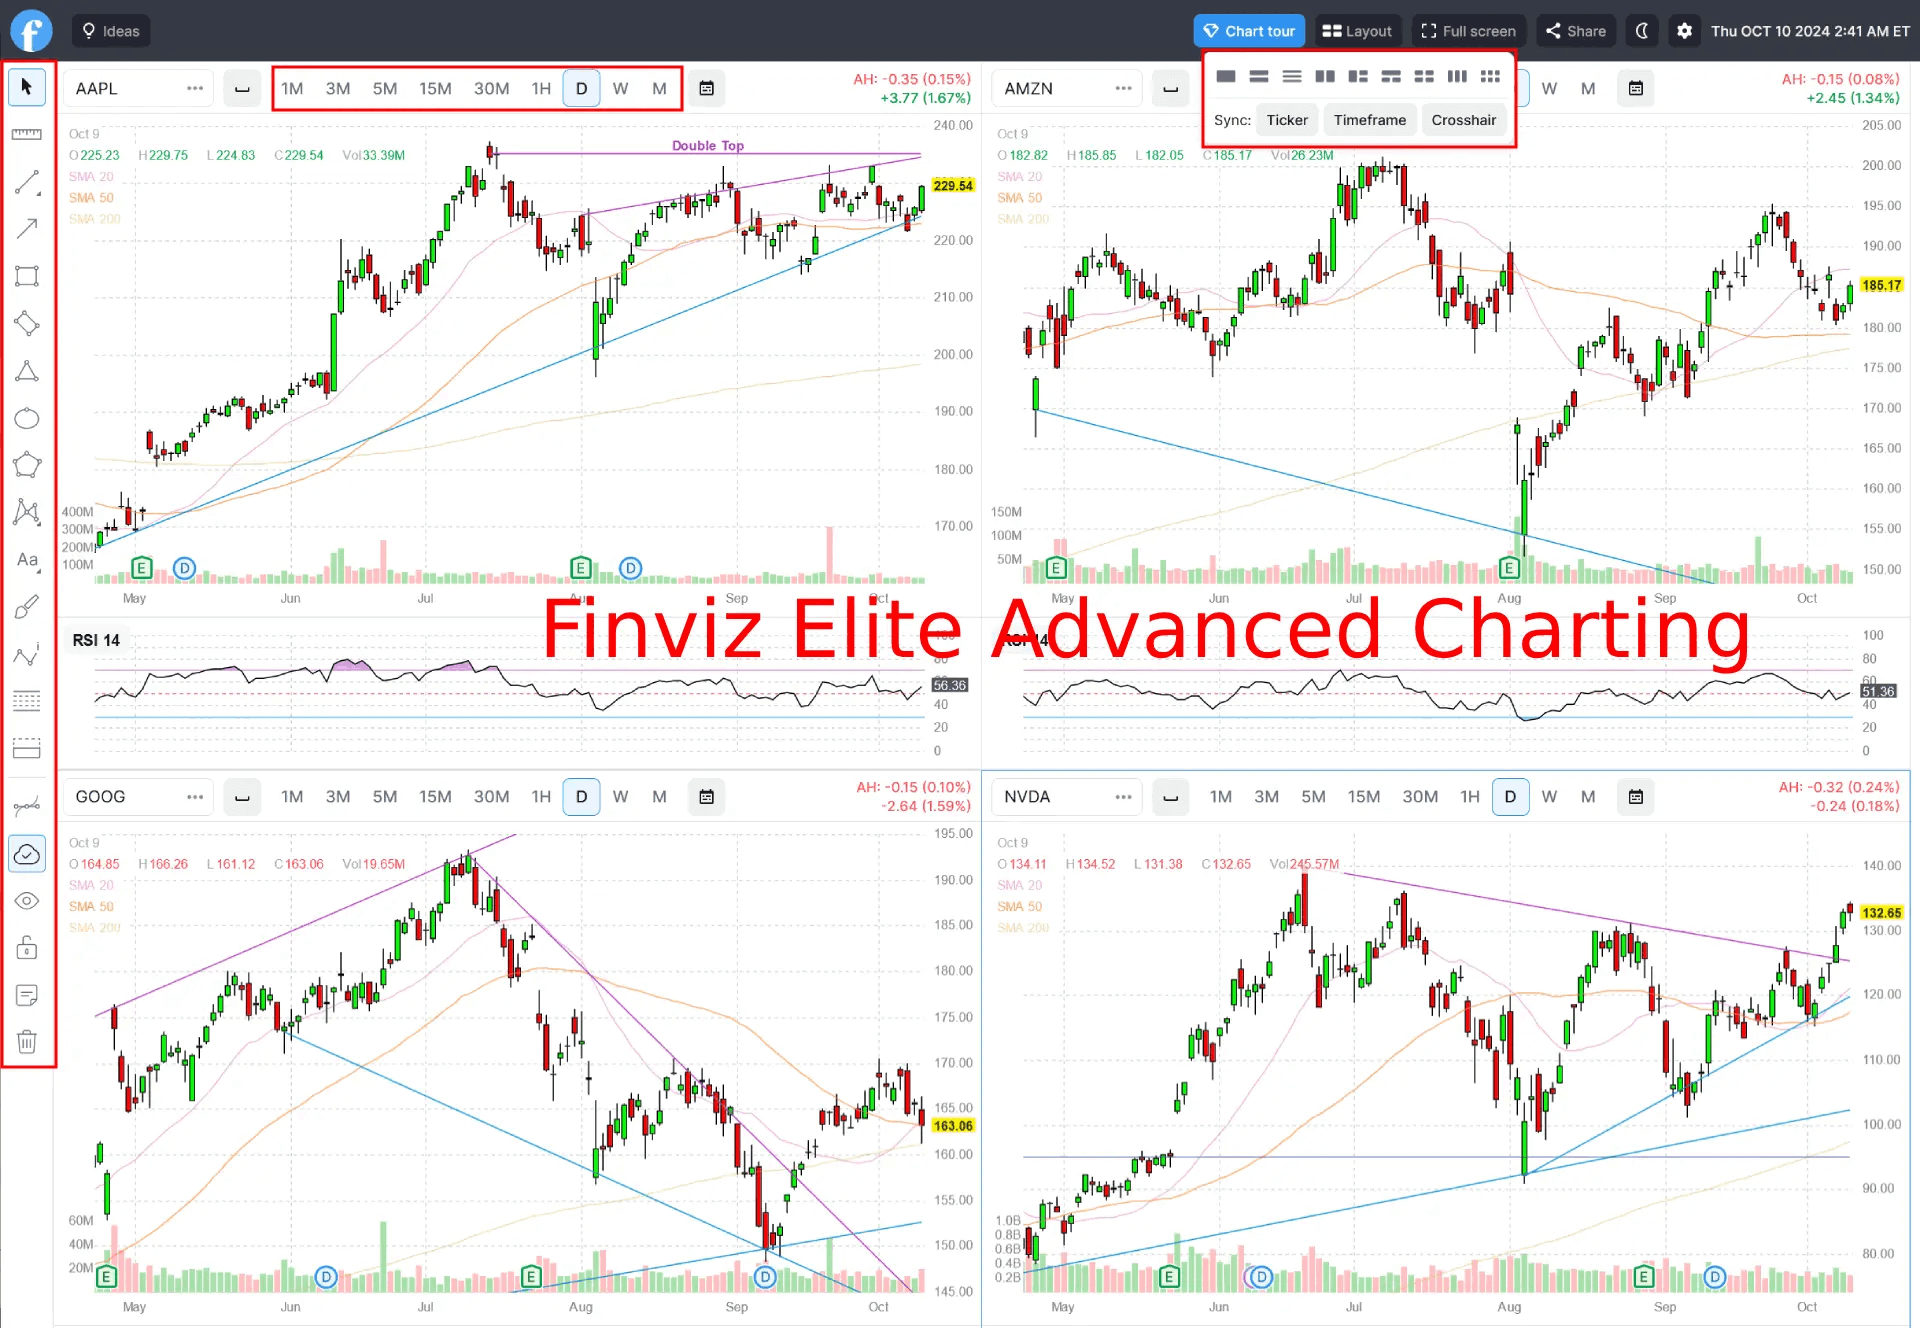
One real limitation worth naming: there’s no zoom on the interactive chart. Traders coming from TradingView will notice this immediately. Finviz is entirely web-based and has made a deliberate trade-off: speed over chart interaction depth. The performance comparison chart (overlay multiple tickers over a selected period to compare relative strength) is genuinely useful for equity analysis. But if your charting workflow depends on fluid zooming, pinning, and manipulating price action at the bar level, TradingView handles that better. Finviz knows this and isn’t trying to win that fight.
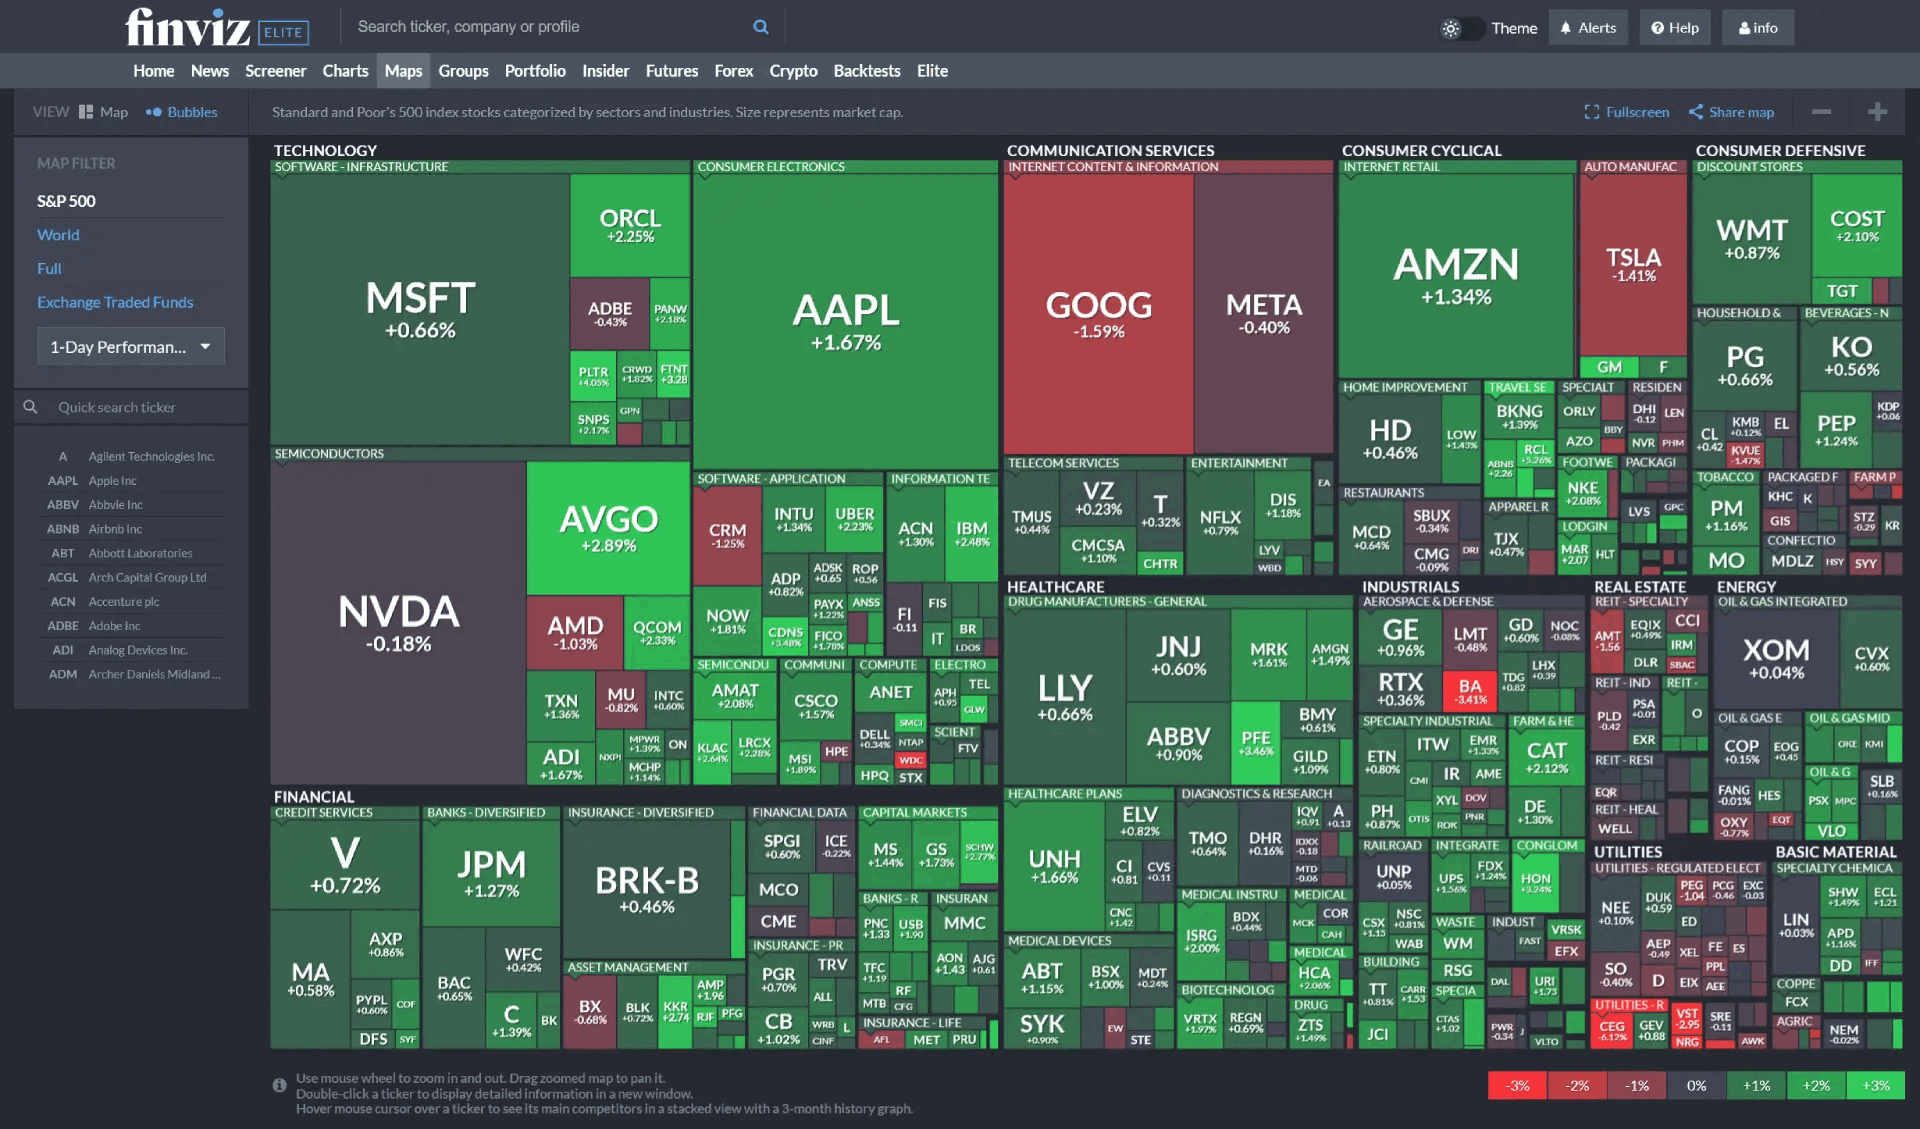
The heatmaps are worth highlighting separately. Tile size reflects market cap. Color reflects daily performance. You can filter by S&P 500, world stocks, sector groupings, or ETFs.
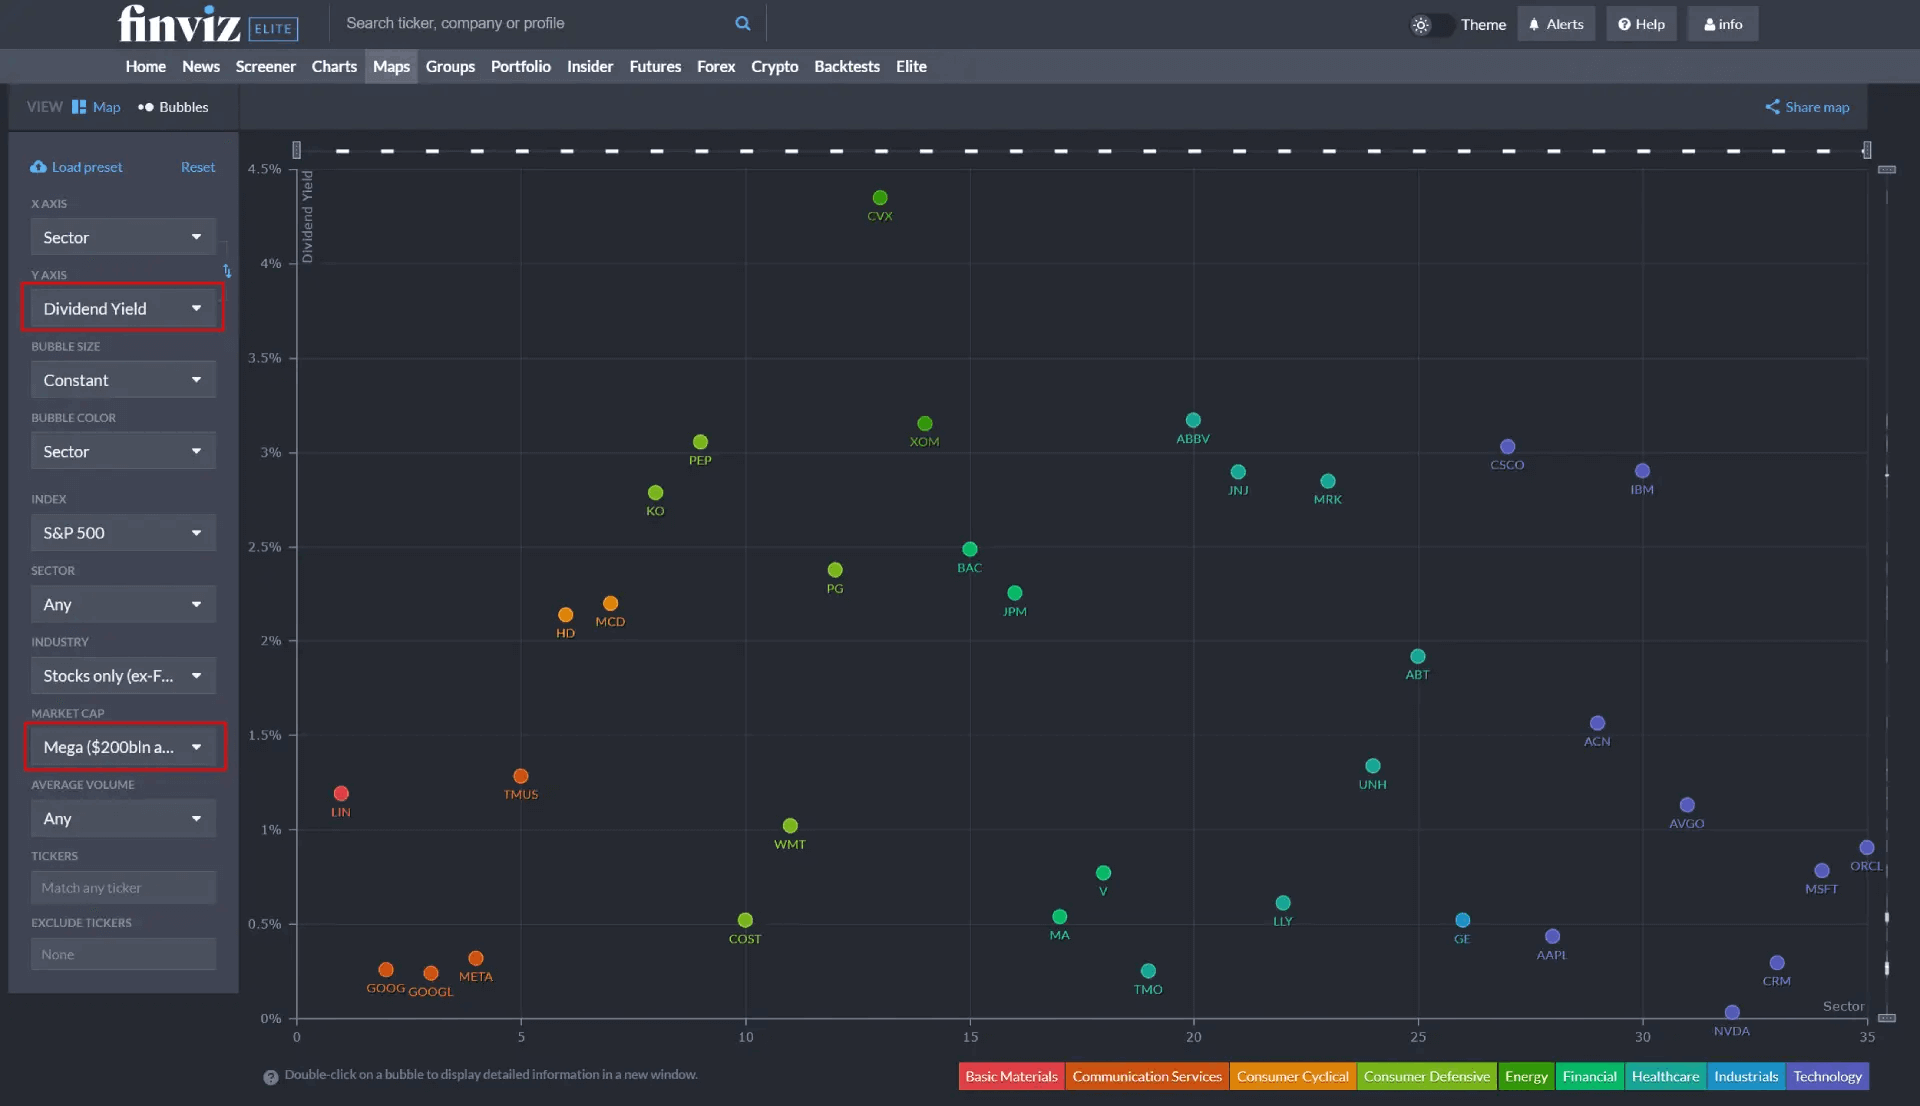
There’s also a newer bubble visualization mode where you set custom X and Y axes (change percentage against market cap, for example) to build a relative performance picture across sectors in a way that tables can’t replicate. For a futures trader who wants to know which sectors are driving index moves before the open, this is the view to have up.
The Futures Tab: Useful Context, Not an Execution Tool
The futures section is a market overview panel. ES, NQ, YM, ER2 (Russell 2000), CL, GC, NG. They’re all there, color-coded by daily performance with embedded charts visible on hover. There’s a daily relative performance bar that ranks futures from best to worst performer, which works well as a quick pre-market read on correlated instruments.
That said, this is a 20-minute delayed overview even on Elite. You’re not using this to trade. You’re using it to understand the broader macro context before you open your actual trading platform. Think of it as the dashboard glance before you get to work, not the work itself. For that specific job, it’s genuinely well-designed.
Backtesting
The backtesting module is Elite-only, and it’s honestly a mixed bag. Useful for what it does, limited in what it can do. Entry and exit conditions can be built from 100 technical indicators and chart patterns. Long and short strategies are both supported. Transaction costs and stop loss levels are configurable. The output includes a return graph, monthly return table, and benchmark comparison against SPY. The historical database covers 16 years of daily data.
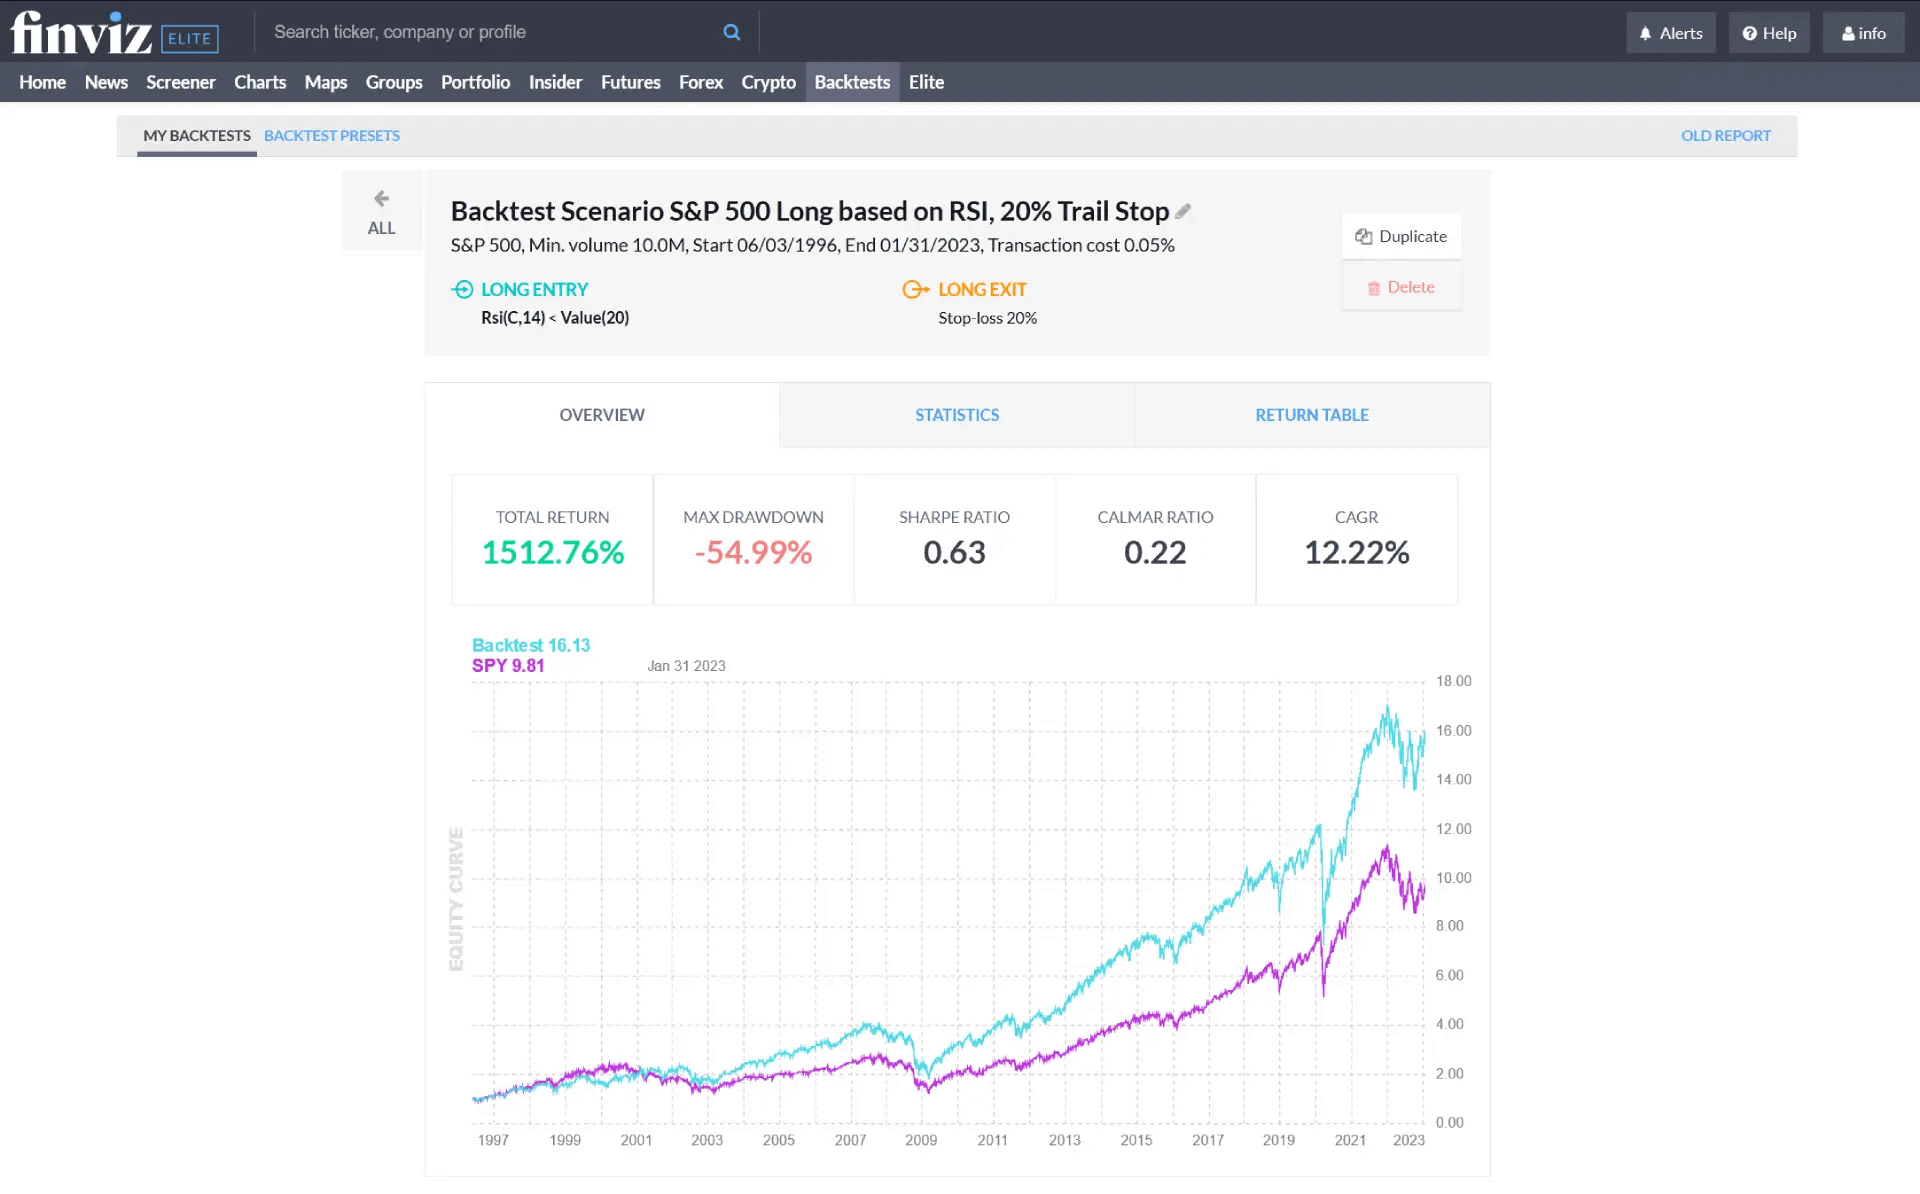
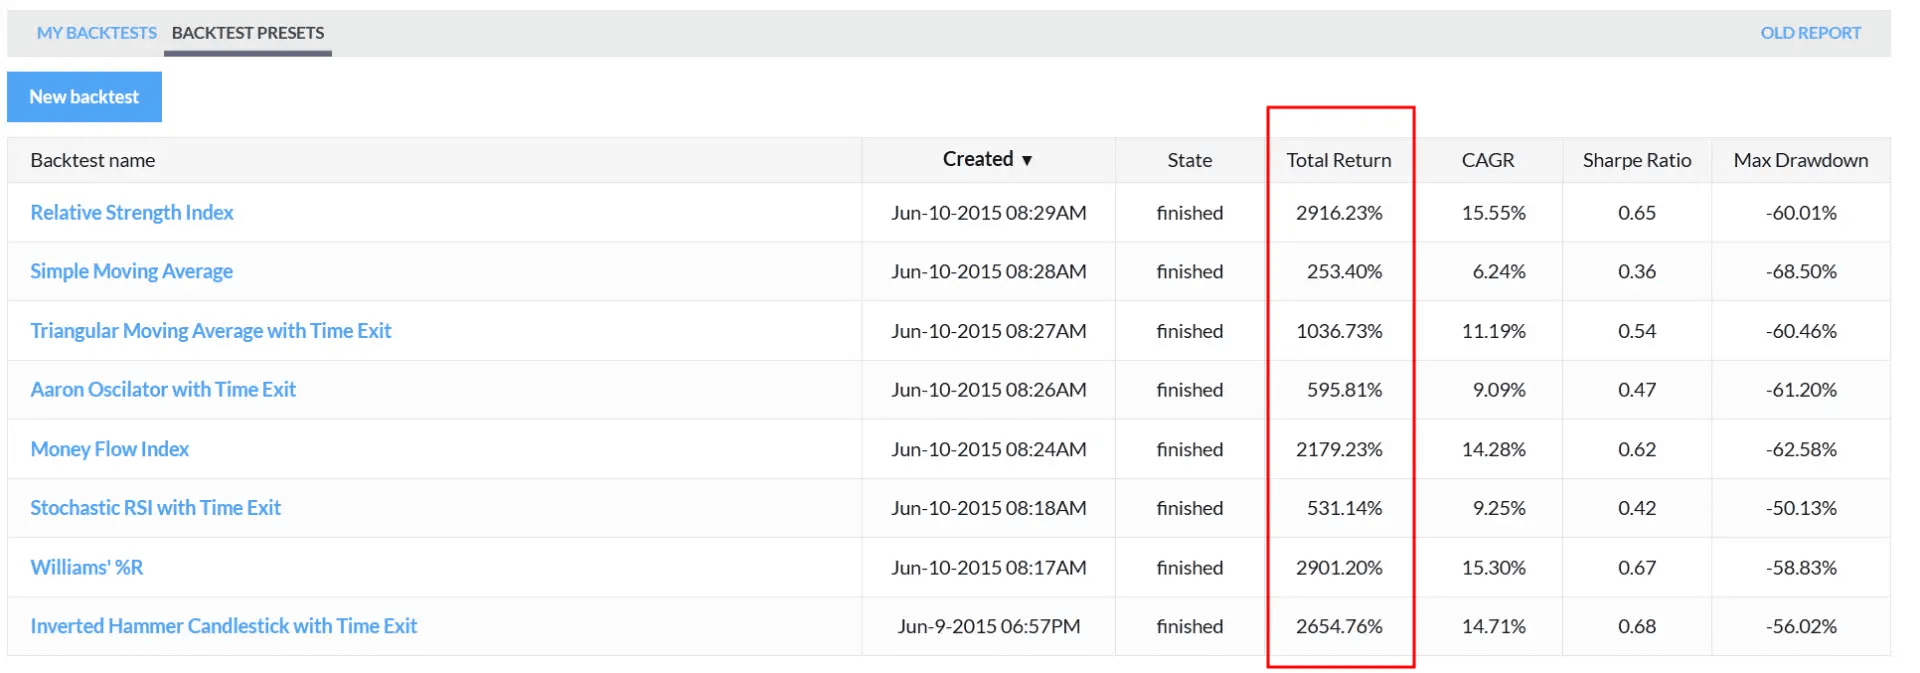
The constraint is right there in that last sentence: daily data only. Intraday strategies can’t be tested here. Complex multi-condition logic isn’t supported either. For a swing trader who wants to validate a simple technical setup (EMA crossover, RSI threshold, that sort of thing) this is a useful starting point. For anyone who backtests seriously at the intraday level, Trade Ideas is the tool for that work. Calling the Finviz backtester more than a helpful supplementary feature would be generous.
Try Finviz Elite 7 days for free, register for a free account, or save 36% with annual plans.
Everything Else Worth Mentioning
The news feed aggregates headlines from Bloomberg, MarketWatch, Reuters, CNN, and a range of financial blogs, sortable chronologically or by source. It’s a decent pre-session read and a useful sanity check before entering a position. Not a replacement for a dedicated news terminal, but more than sufficient for most traders’ daily context needs.
The correlations feature (Elite only) identifies stocks with statistically related price behavior to any given ticker. When a leading name makes a sharp move, correlated stocks often follow as the trade rotates. Having that relationship visible without manual research has obvious practical value for equity-focused sessions.
Insider trading data pulls directly from SEC filings, filterable by transaction type, insider role, and time period. It’s a confirmation signal more than a primary research tool, but having it accessible in the same interface without a separate platform login is a genuine convenience.
Price alerts are available on Elite: price, news, insider activity, ratings changes, and SEC filings. Setup is functional but basic. Most dedicated trading platforms offer more sophisticated alert conditions with faster notification. For monitoring a watchlist of key price levels, it’s adequate. It’s not a reason to subscribe on its own.
Pricing
Finviz Elite runs $39.50 a month on a monthly basis, or $299.50 a year, which works out to $24.96 a month on the annual plan. New accounts get a 7-day free trial that covers every Elite feature. Credit card is required at signup, and it auto-renews after 7 days unless cancelled before the trial ends. A 30-day refund is available on written request.
The annual plan saves $174.50 compared to 12 monthly payments. That’s the only pricing lever available. The annual discount is it. Try Finviz Elite 7 days for free, register for a free account, or save 36% with annual plans.
Compare that to TradingView, where a comparable plan with real-time data runs in a similar monthly range. TradingView wins on charting depth and chart interaction. Finviz wins on screening breadth, data density, and speed. A lot of active traders use both: Finviz to identify what to look at, TradingView to analyze it. That combination isn’t necessarily redundant. They genuinely do different things well.
Who This Is For
For equity traders, swing traders, and investors who want fast, data-dense screening and market-wide context, Finviz is a straightforward recommendation. The free version is genuinely useful, not crippled, not a bait-and-switch. The Elite tier adds real-time data, pre-market scanning, the full CSV export, and backtesting at a price point that’s difficult to match for the feature set.
For futures traders specifically, the fit is narrower but real. The heatmaps, the futures overview panel, and the pre-market screener all serve a legitimate pre-session role. If your session prep involves understanding equity market breadth, sector rotation, and what the index futures are doing relative to each other, Finviz gives you that picture faster than building it manually anywhere else.
What it isn’t: an execution platform, a charting terminal, or a substitute for NinjaTrader, Tradovate, or Rithmic. The 20-minute delay on futures data makes sure of that. Tick charts aren’t available at any subscription tier. There’s no order routing, no DOM, no sim mode. None of that is what Finviz is trying to be.
At $24.96 a month on an annual plan, with a week to try it first and 30 days to ask for a refund if it doesn’t fit your workflow, the risk of testing it is essentially zero. The question is whether you need what it does. For traders who spend time building a market picture before each session, it’s worth finding out.